:::: MENU ::::
TOP

ESA SEOM-S2-4Sci Land and Water Multitemporal Analysis (MTA)

SEOM program

The “S2-4Sci Land and Water – Multitemporal Analysis” initiative was launched in the context of the “Scientific Exploitation of Operational Missions” (SEOM) program. The program aims at favouring: i) research and development studies, ii) development of toolboxes, iii) interaction between scientists and users; iv) training of new generation scientists in the field of Earth Observation (EO); and v) the outcomes of research in terms of data and results. These needs emerge because a very large number of images are now available to either the scientific and user communities from past/current EO missions (e.g., ERS, Landsat) and even more will be available due to the upcoming EO missions. Among those the Copernicus Sentinel program will contribute with an exponential growth of data of a large variety. This opens to an unpredictable wide range of possibilities. Among the various Sentinels, the “S2-4Sci Land and Water – Multitemporal Analysis” project focuses on the Sentinel-2 (S-2) family to perform advanced multitemporal analysis.

Multitemporal Analysis (MTA) Project

The intrinsic multitemporal nature of satellite Remote Sensing (RS) images is a high valuable property that can be used to perform accurate monitoring of the Earth’s surface and atmosphere. However, handling the time variable together with the spectral and spatial one is a complex task. For this reason, the development of advanced methods for the analysis of multitemporal data is one of the most important and complex task of the RS community.

Having 13 spectral bands, 10 to 60 m spatial resolution and a revisit time of 5 days upon complete constellation, S-2 guarantees an enhanced continuity to SPOT and Landsat missions. Due to the high temporal resolution, S-2 generates dense time series of images with a worldwide coverage. This increases the potential of analyzing dynamic phenomena and extracting multitemporal information, as well as to have a frequent coverage also in areas that maybe affected by cloud cover. With respect to previous similar missions (e.g., Spot and Landsat), S-2 provides optical images with higher spatial, temporal and spectral resolutions. In the domain of multitemporal information extraction this represents a great improvement with respect to the past, that opens to a wide range of new possibilities in the field of multitemporal analysis.

In this context, the MultiTemporal Analysis (MTA)  project is designed  to define techniques and algorithms tailored on the specific properties of S-2. The project aims at developing emerging methods for advancing the technical knowledge and capacity to analyse S-2 data and provides a series of tools to better exploit S-2 temporal information in the future.

For more information about S-2 mission and SEOM program please visit:

Application Areas

In the context of ESA S2-4Sci Land and Water  SEOM study, the MTA project investigates three main application and methodological areas:

  • Time series analysis: the potential offered by the S-2 series, in terms of dense time series of data, opens the door to the development of new and advanced techniques for the joint analyses and exploitation of time series of data. The methods should aim at identifying and classifying temporal patterns and spatial/temporal land cover transitions in the S-2 multitemporal dataset.
  • Change detection and attribution: due to the increased revisit time of S-2 satellite, it is necessary to develop land cover change detection strategy suitable for S-2 data that may allow a systematic identification and attribution of changes in land cover at large scale.
  • Land cover maps updating: the regular generation of land cover classification maps (specially at global scale) is a complex and time consuming problem that if done independently (different maps computed independently in different times) may affect the temporal consistency of the land cover information and even the impossibility to compare them in time. The regular update of a reference map based on multitemporal analysis may overcome some of the methodological problems to be faced ad may enhance the temporal consistency of the obtained results.

According to the project requirements, the final methods should be automatic to require small interaction with the user. Moreover, the final implementation should be scalable to work easily on large images.

Project Planning

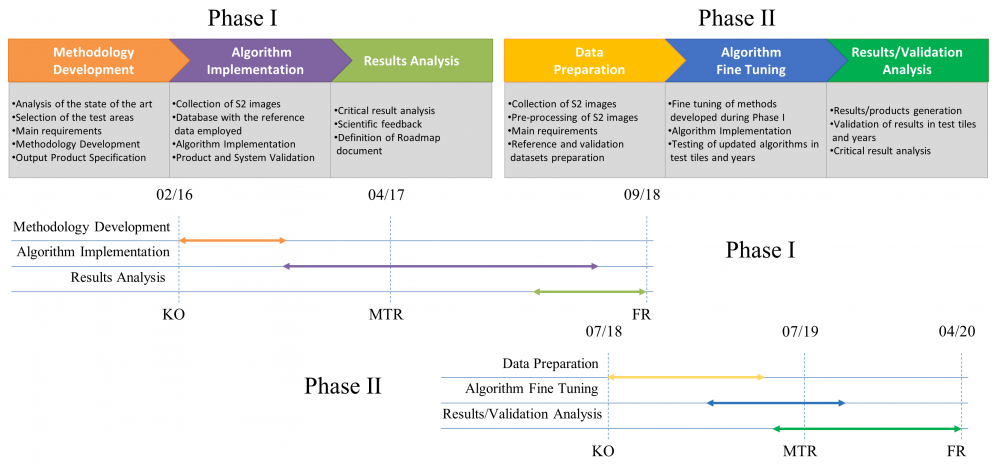
The project activities are split into two phases carried out one after the other. Phase I is carried out in the three application areas, whereas Phase II is applied only in the first and third application areas.

Phase I

  • Methodology Development: is devoted to a comprehensive and detailed analysis of the state of the art and of the relevant projects. The test areas and the preliminary methodologies to be developed are investigated in this task.
  • Algorithm Implementation: is devoted to the implementation and testing of the algorithms identified by Task 1 and the validation of the resulting output products. To this end a cyclic workflow approach that includes a continual development-validation-feedback loop is considered in the implementation phase.
  • Result Analysis: documents and provides a critical analysis of the feedback from scientists and institutions collected through consultations in ESA and third party workshops, symposia, and conferences. On the basis of the feedback a Scientific Roadmap document will be developed that identifies the scientific priority areas and provides the guidelines for future scientific data exploitation projects.

Phase II

  • Data Preparation: is devoted to the collection and pre-processing of S-2 images together with the preparation of reference and validation data.
  • Algorithm Fine Tuning: is devoted to a tuning and test of methodologies developed during Phase I in order to render them suitable and robust to work at Country (large scale) level. Works similar to its analogue in Phase I with a cyclic workflow approach.
  • Results/Validation Analysis: documents and provides a critical analysis of the outputs and validations at Country level as well as their coherence from one tile to another.

Project Objectives

The overall science objectives of the MTA project are:

  • Time series analysis: to perform precise agricultural analysis by fully exploiting the specific properties of S-2 images. Precision agriculture generally involves better management of farm inputs such as fertilizers, herbicides or seeds. Typically, large farm fields under conventional management receive uniform applications of fertilizers, irrigation or seeds. In the framework of the precision agriculture, these farms can be divided into single parcels receiving customized inputs based on varying soil types, landscape position, and management history.
  • Change detection and attribution: to perform binary detection of forest changes (disturbances) mainly related to deforestation (clear cuts and logging) in bi-temporal S-2 image pairs. The deforestation problem is gaining more and more attention because of its dramatic extension and many associations are working for providing specific information for monitoring purposes.
  • Land cover maps updating: to use S-2 images to update existing thematic land-cover maps without ground reference data (unsupervised case). In the considered application, the image used to generate the existing map is considered unknown. Due to the recent S-2 launch, few thematic maps obtained with these data are currently available. Thus, the team is also investigating the possibility of updating existing maps generated with different RS data.

Theme 1: Time series analysis

Problem Formulation:

Dense time sampling increases the sensitivity to dynamic phenomena and provides a better description of them. With the increased revisit period of the complete S-2 constellation (return frequency up to 5 days), it is possible to perform accurate seasonal trend analysis. In this framework, specific applications regarding low cost precision agriculture is of great interest given that S-2 has specific bands in the Red-Edge spectral range dedicated to the study of vegetation that were not available in previous multispectral sensors (e.g., Landsat, SPOT). In the time series methodological area, the focus is set on the monitoring of single crop fields in agricultural areas.

Project Output:

Satellite Image Time Series (SITS), such as the ones acquired by Sentinel-2, combine a large amount of information, compared to previous satellite generations, since a better trade-off in terms of spatial/spectral/temporal resolutions is guaranteed. These type of information becomes relevant in the agricultural analysis, where availability of dense SITS is required to map and analyze fast changing crop behaviors. The high spatial resolution offered by Sentinel-2 allows to separate and analyze single crop fields, even when their size is relatively small (lower than 9.4ha, as it frequently happens in Europe w.r.t. 19.6ha in US), with a high temporal resolution. In the literature, several methods exist that analyze the evolution of crop fields, by aggregating them, but none is fully able to work: i) at single field level; and ii) with irregularly sampled data. In this project, we developed an approach for the analysis of spatio-temporal evolution of crop fields in SITS that is able to deal with the spatial/spectral/temporal characteristics of S-2 data. Two different cases were analyzed: Phase I. For a small area located in Barrax, Spain and over one year and a half of data; Phase II. Adaptation of Phase I algorithms to work at Country scale level (Italy) for agrarian years 2017 and 2018.

Phase I

Experiments were carried out from S2-SITS acquired over Barrax, Spain, in the period July 2015 – November 2016, where a total of 76 images were available, but only 49 were used for the analysis, given the non-presence of clouds.


Sentinel-2 images distribution for the period July 2015 – November 2016 in Barrax, Spain.

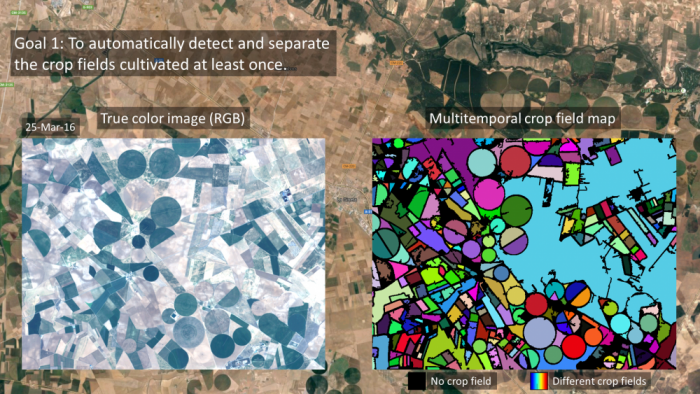
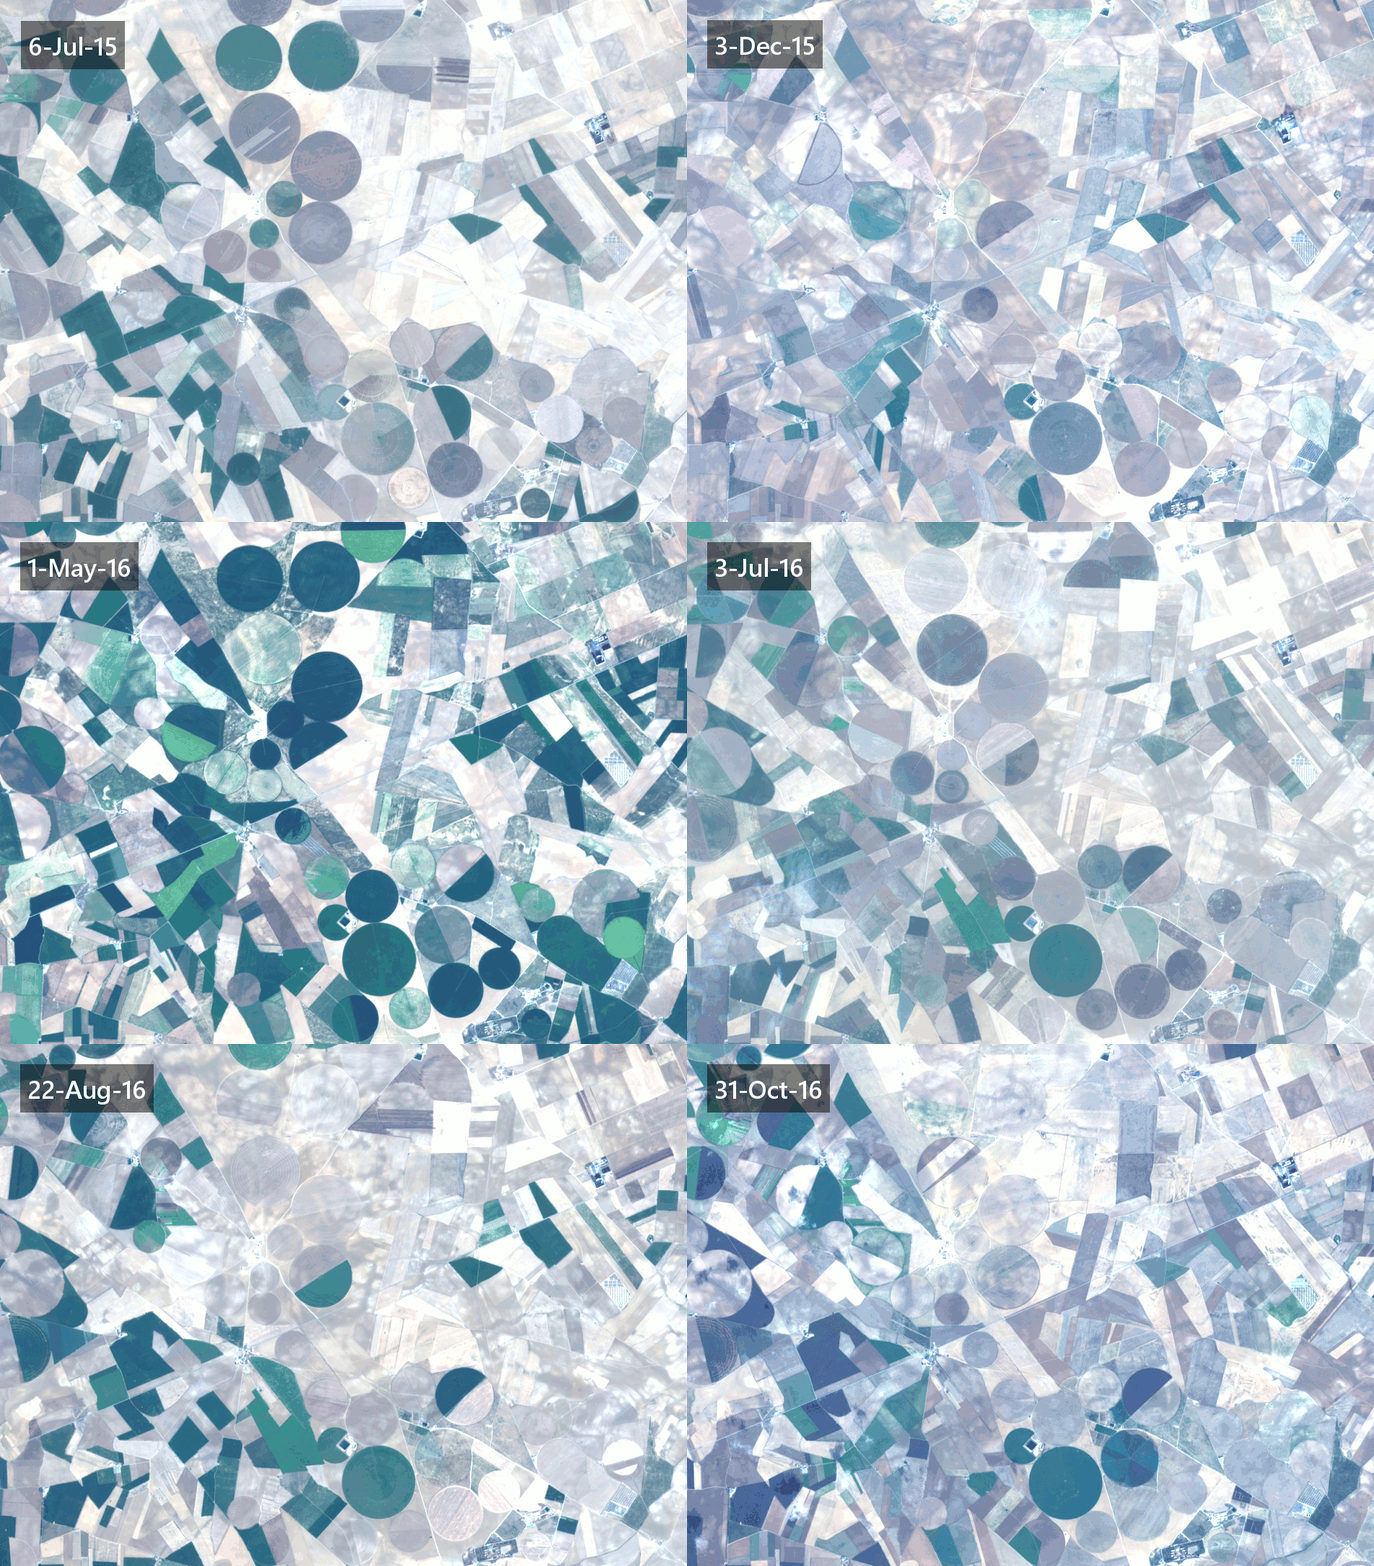
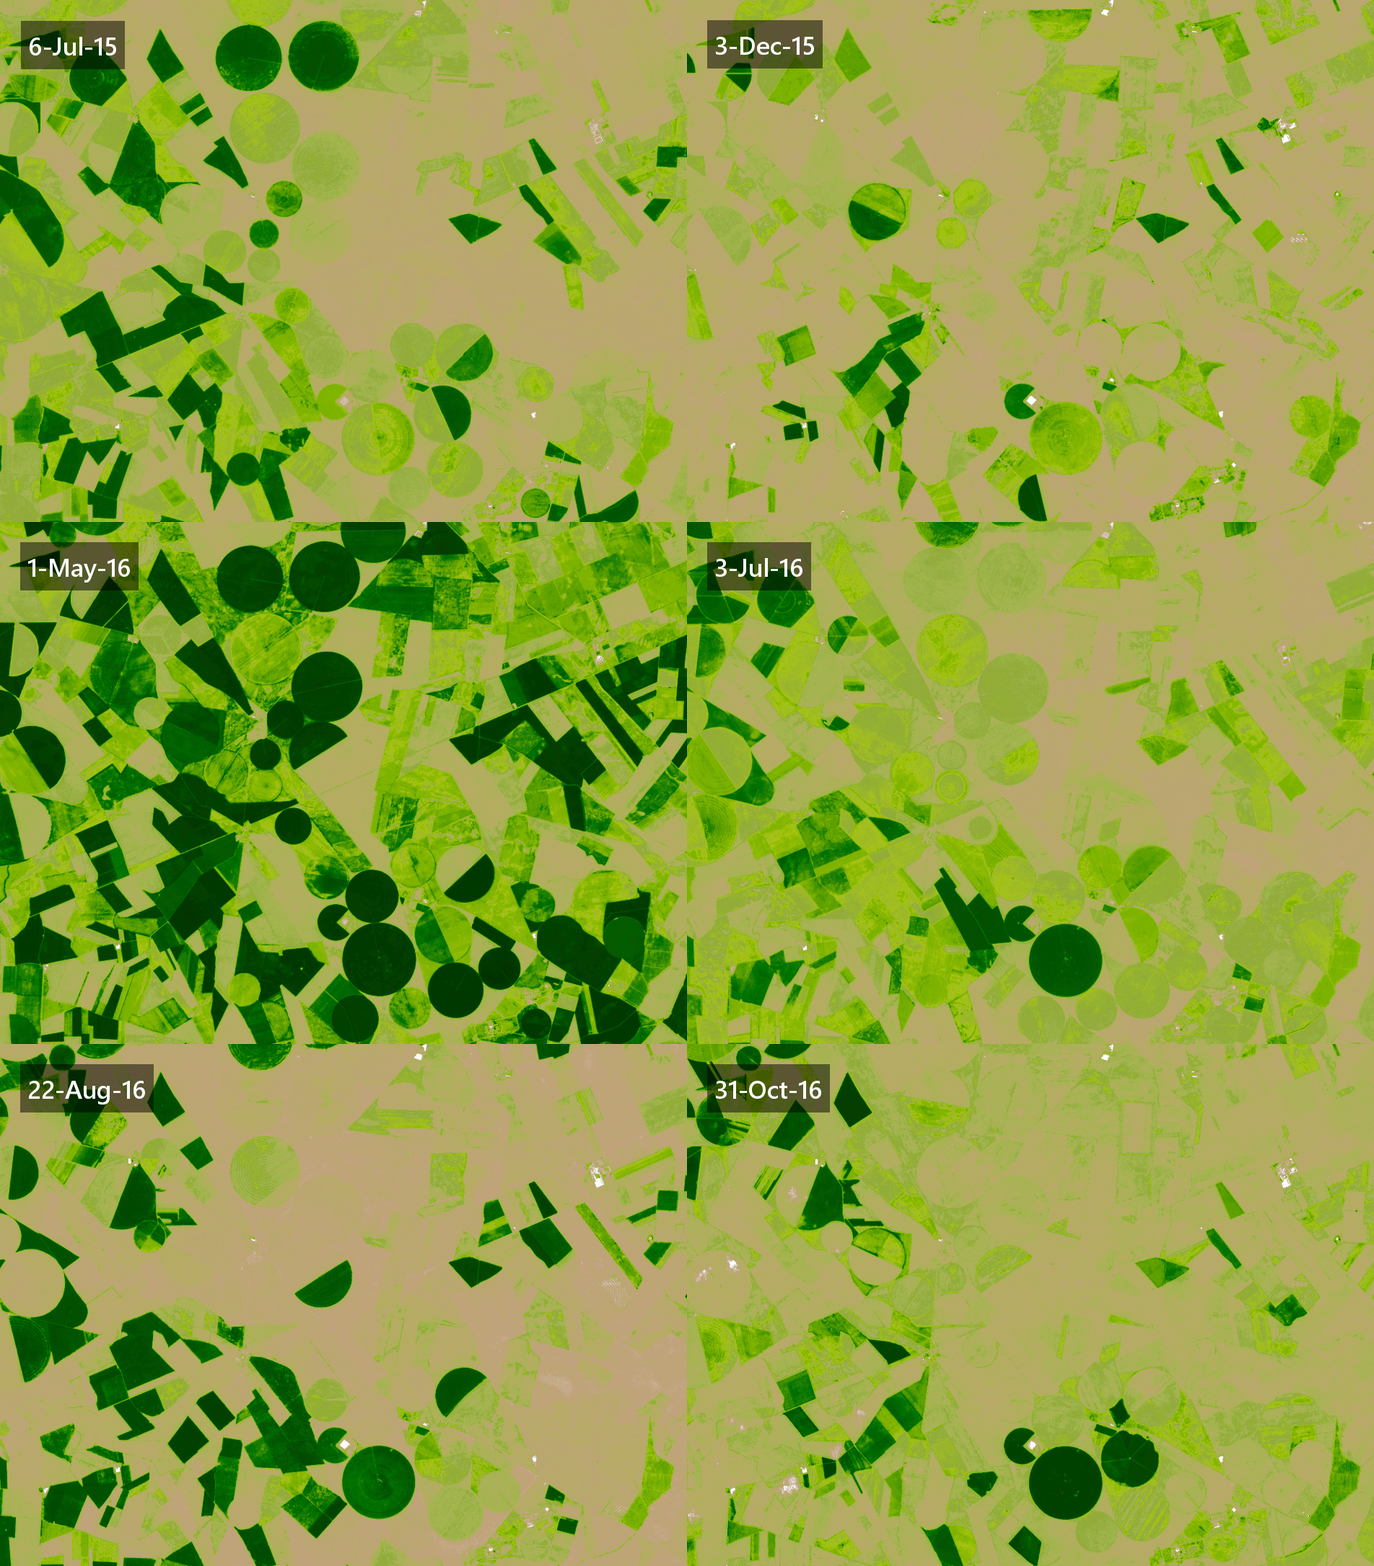
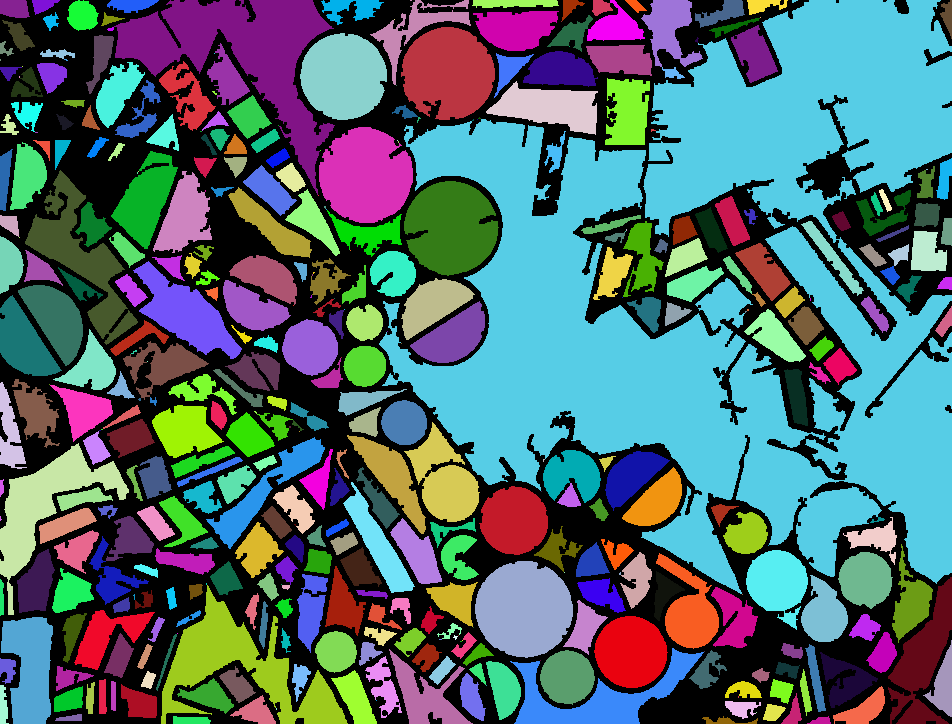
To this aim, four steps are followed: i) pre-processing of the S2-SITS, ii) spatio-temporal fusion, iii) spatio-temporal evolution analysis; and iv) spatio-temporal information extraction. For the spatio-temporal fusion, the system identifies and separates all the crop fields cultivated at least once over a given area based on their vegetation spatio-temporal evolution.

RGB images

Normalized Difference Vegetation Index (NDVI)

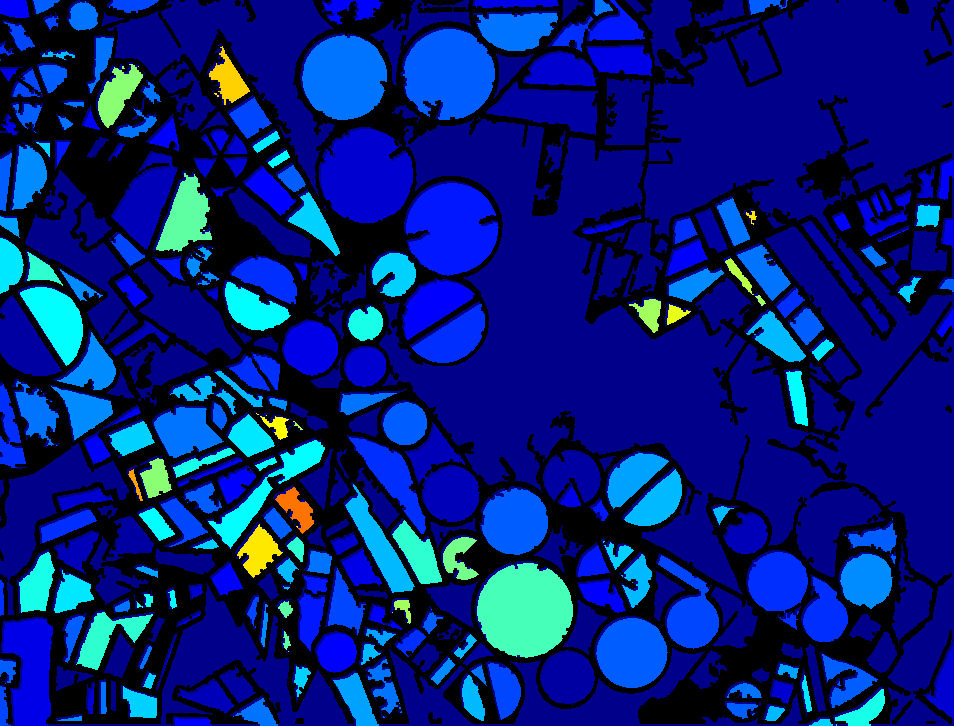
Multitemporal crop field map

Barrax (Spain) agricultural area over the period from July 6th 2015 to November 20th 2016.

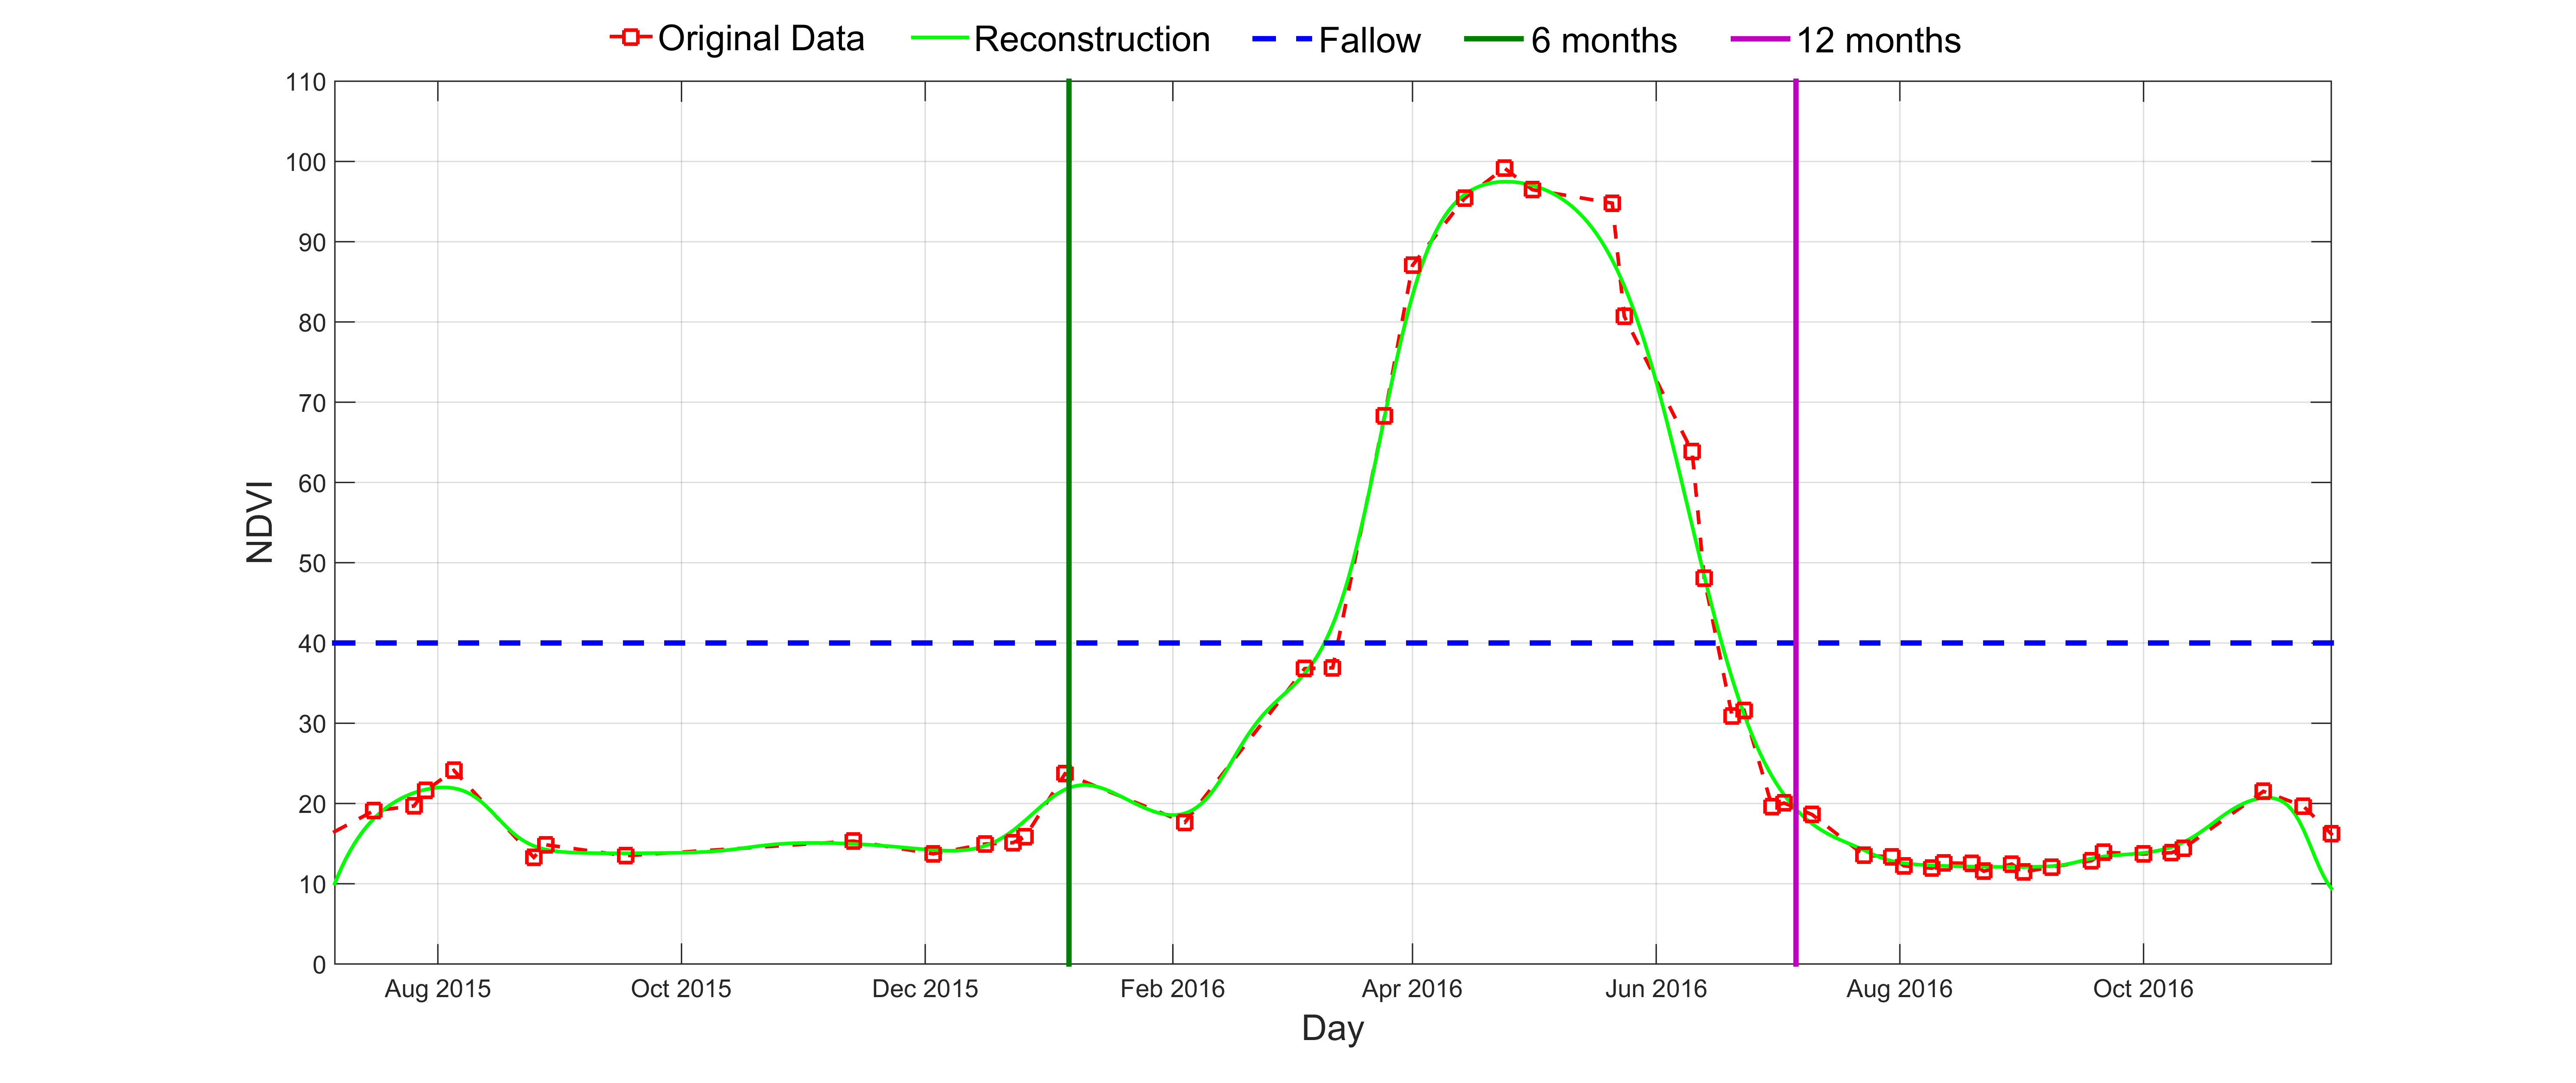
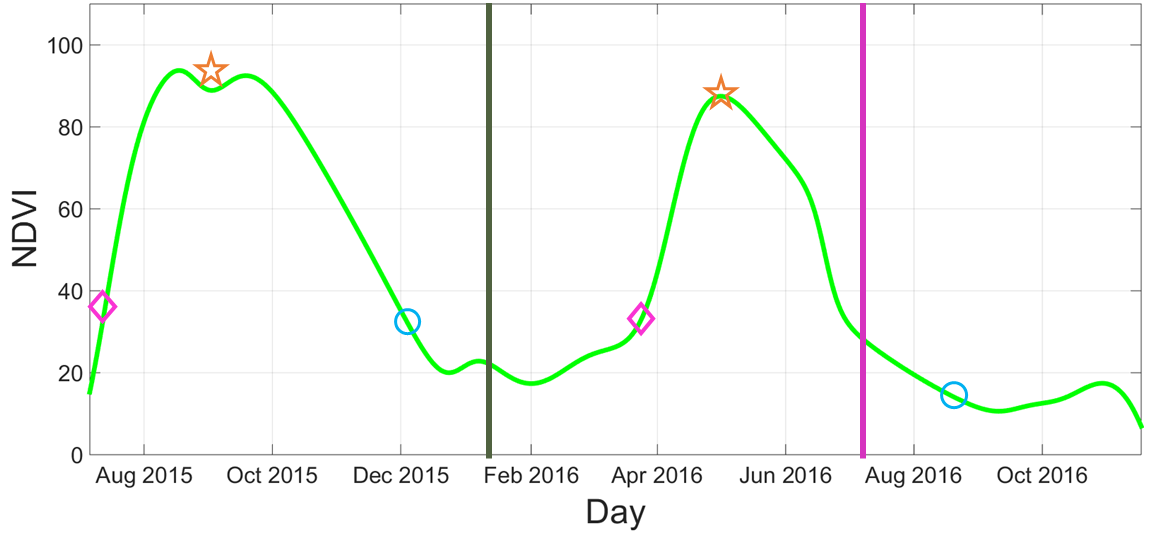
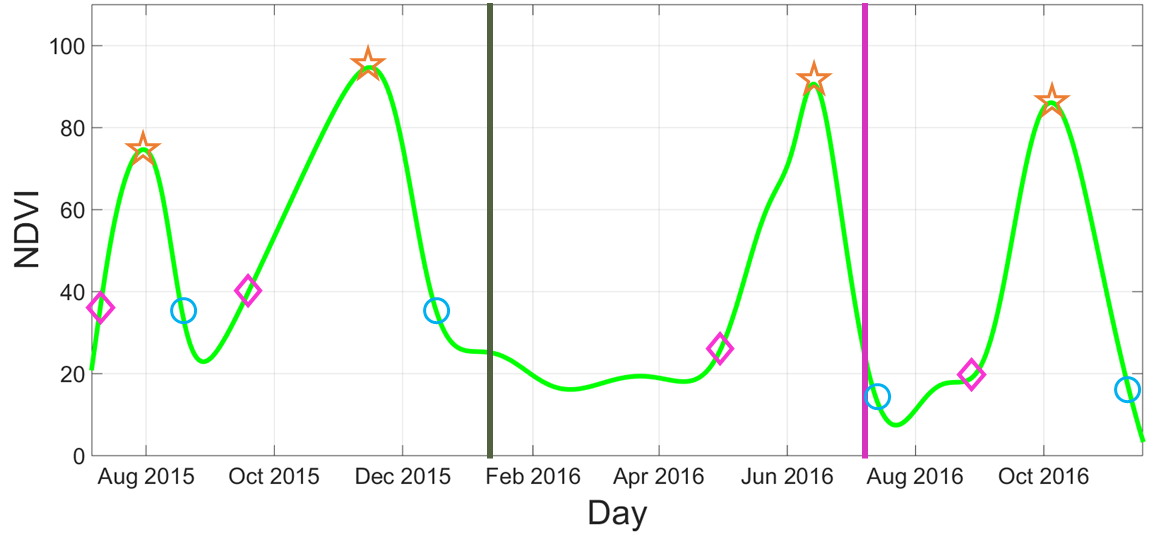
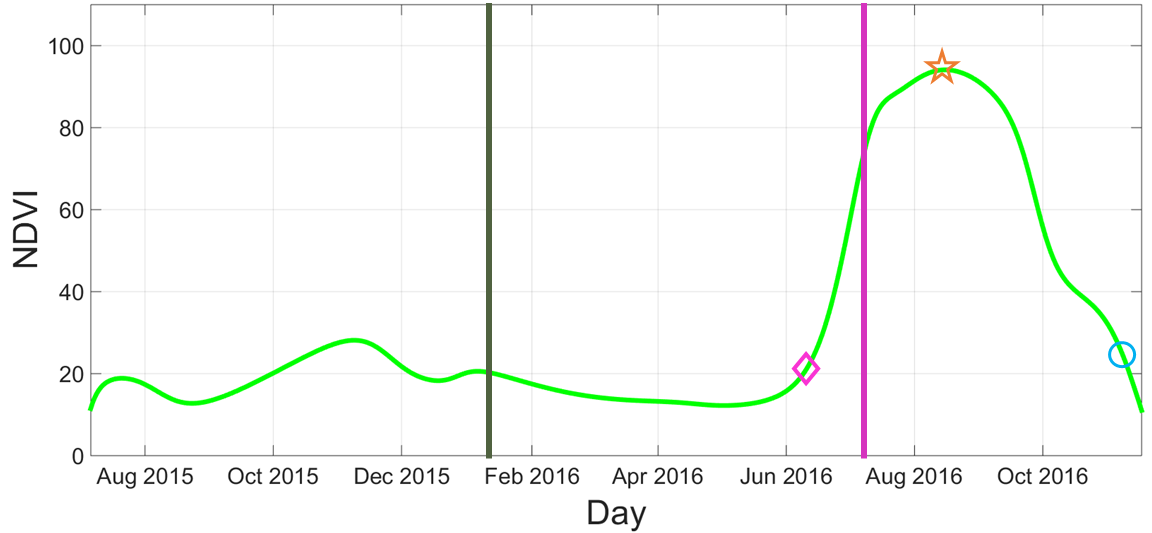
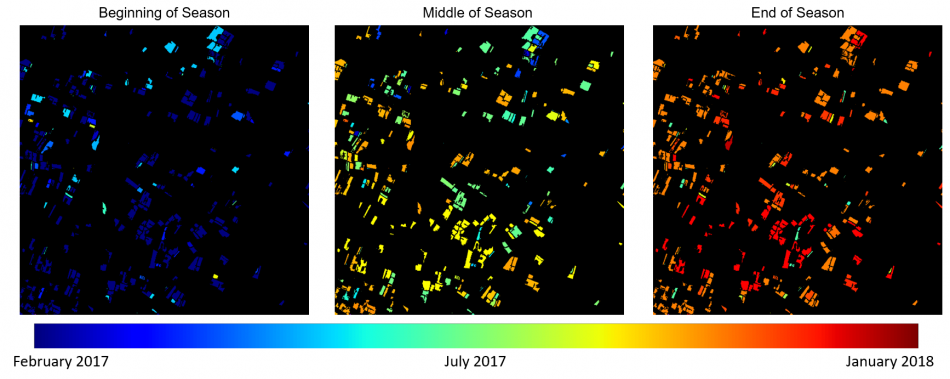
For the spatio-temporal evolution, the system reconstructs continuous and regular sampled S2-SITS at single crop field level by means of an adaptive non-parametric regression model. For the spatio-temporal information extraction, two types of information are considered: i) extraction of phenological parameters and ii) creation of cumulative indices maps. For the phenological parameters extraction, the trend of the mean NDVI, at single crop field level, is used to derive their phenological behavior and create maps related to beginning, middle and end of season. This same information is then used to create maps indicating information such winter/summer cultivation period.


Example of the original and continuously reconstructed mean NDVI for a single crop field.

Beginning of season

Middle of season

End of season

Phenology estimation maps over a 12 months period.

Phenology estimation for three sample crop fields: beginning of the season, middle of the season. end of the season.

For the creation of cumulative indices maps, well-known thresholds from the literature are used as starting point over given radiometric indices in order to generate a map offering critical or relevant information at single crop field level. Such are the cases of the NDVI and NDWI indices, where a threshold over 0.5 can provide information about how many times a field has been cultivated over a given period, and how many times there was presence of water on that field.

Cumulative NDVI

Cumulative NDWI

Mean cumulative NDVI and NDWI with a value higher than 0.5.

Phase II

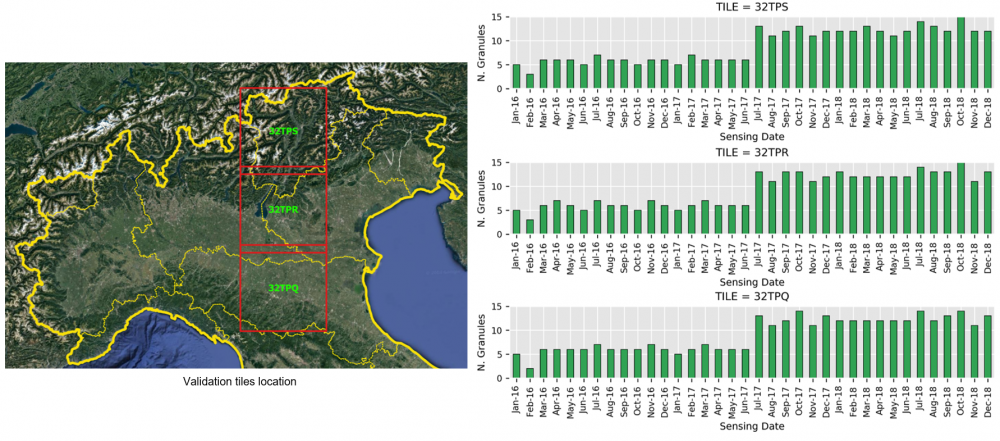
Products were generated from S2-SITS acquired over whole Italy (60 tiles – 19660 S-2 images) in the period November 2016 – October 2017 (2017 agrarian year) and November 2017 – October 2018 (2018 agrarian year). For validation purposes, three tiles were used: (i) 32TPS – Trentino Region, (ii) 32TPQ – Veneto Region and; (iii) 32TPR – Emilia Romagna Region.

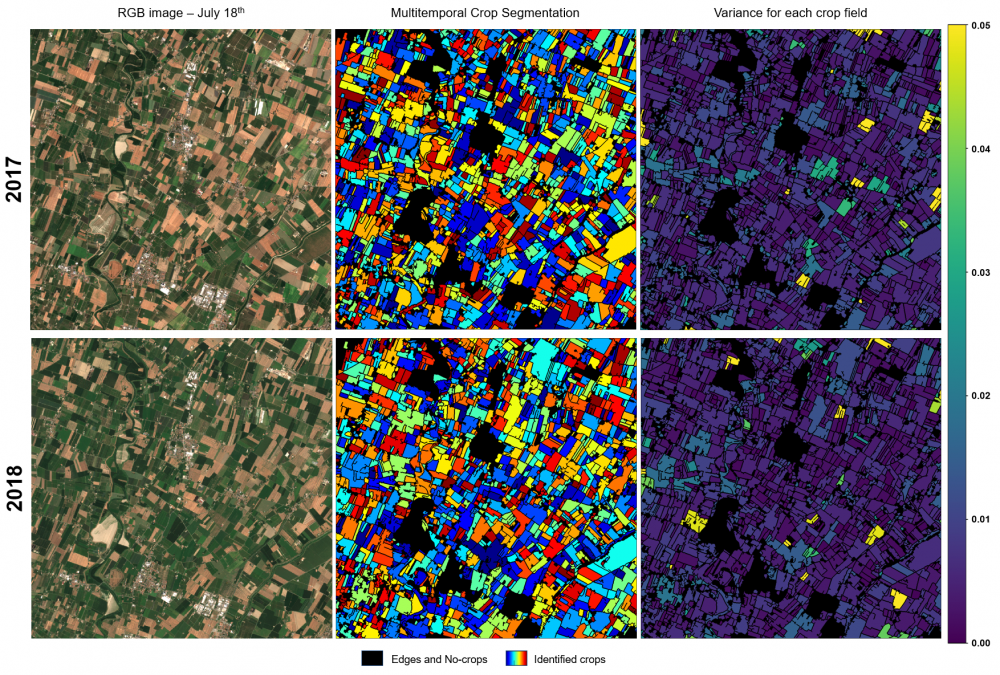
As for Phase I, four steps are followed: i) pre-processing of the S2-SITS, ii) spatio-temporal fusion, iii) spatio-temporal evolution analysis; and iv) spatio-temporal information extraction. For the spatio-temporal fusion, adaptation was made in order to render the algorithm more robust to the change of spectral and spatial information from one year to another. To this aim an iterative strategy and an adaptive threshold were introduced to the algorithm.

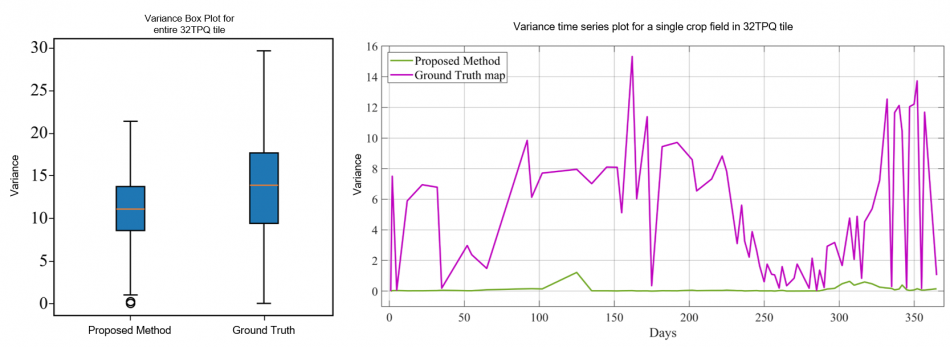
Thanks to the availability of crop type reference map for the 2017 agrarian year, validation was made by comparing NDVI variance of all fields in the tuned multitemporal segmentation map with that of the reference map.  The logic tells us that if crop fields have been separated correctly, the variance inside them should be close to zero. This applies also in the whole temporal evolution, thus we evaluated the variance for a single crop field as well.

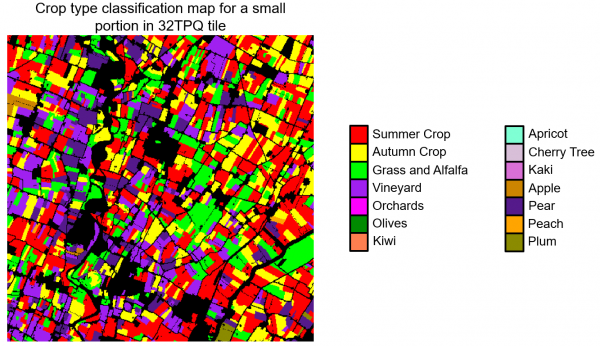
For the spatio-temporal information extraction, only phenological parameters are extracted. As per Phase I, the trend of the mean NDVI is used to derive crop fields phenological behavior and create maps related to beginning, middle and end of season. An example for a small portion in the Emilia Romagna tile is presented. A crop-type classification map (freely obtained from ARPAE) depicting the different crops cultivated in 2017 agrarian year was used to prove the reliability of phenological parameters extraction. If we consider one type of crop (e.g., vineyards), we expect that general behaviour of all the fields with the same type of crop behave in a similar way along beginning, middle and end of season.

Theme 2: Change Detection and Attribution

Problem Formulation:

Change detection has been widely used to assess  land use/land-cover changes. Among them, one of the most interesting is the analysis of forest changes, where the introduction of new imagery from the S-2 satellite is expected to bring significant improvements with respect to the past. Indeed, changes can be now identified at time/spatial/spectral scales never considered before. In this context, for the change detection and attribution area the binary detection of forest changes (disturbances) mainly related to deforestation (clear cuts and logging) in bi-temporal S-2 image pairs is considered.

Project Output:

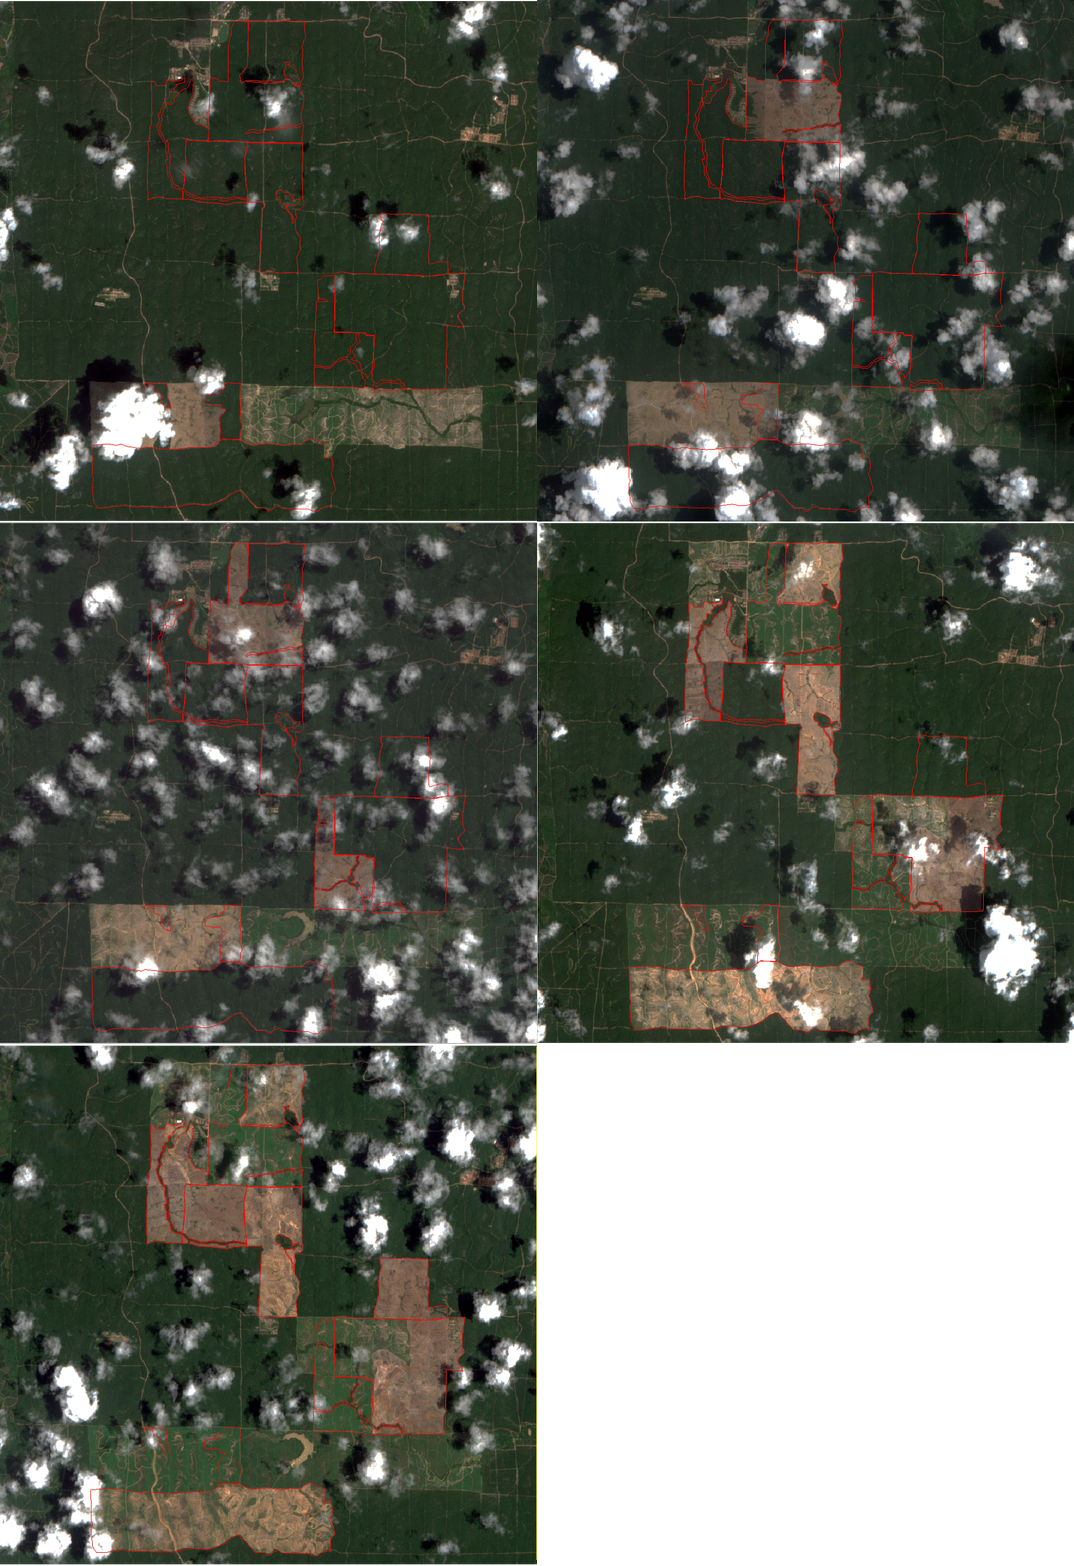
More than ever, forest resources exploitation is strengthened all around the globe. In this respect, the Indonesian forest has been devoted a large interest in the recent years due to an intense and increasing lodging activity associated to it. Indeed, large portions of the forest are cleared to the purpose of harvesting wood and creating land for farming (especially palm oil plantations). This process can be monitored as the typical patterns in which the cuts are made allow for a precise identification by means of remote sensing systems.


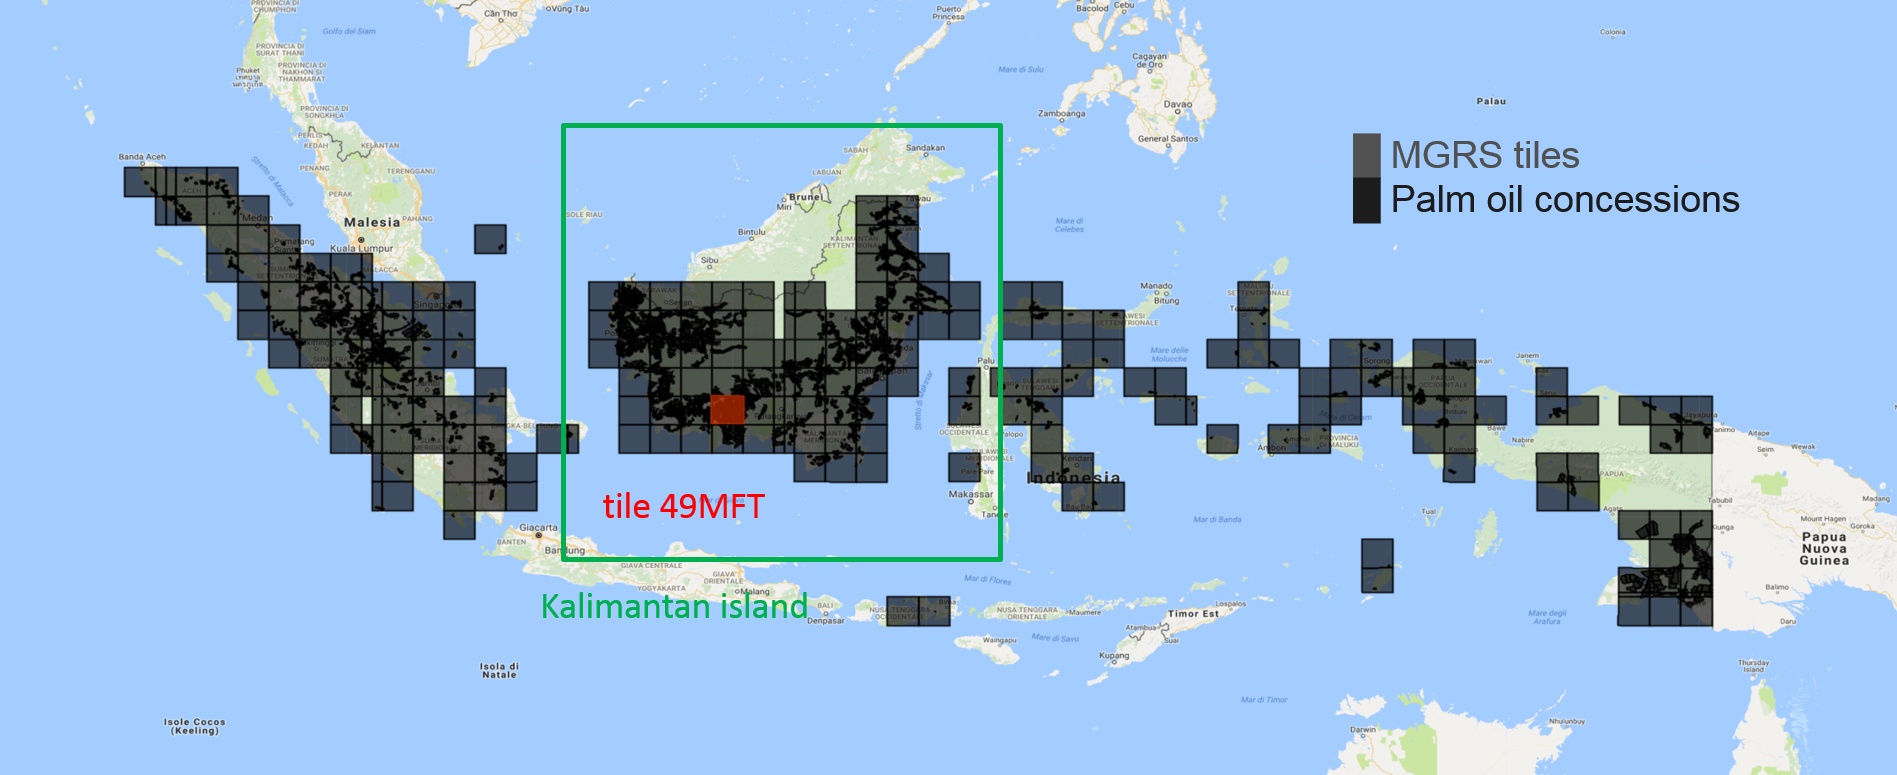
Two study areas analyzed in this project. The largest one is the Kalimantan Island (country scale analysis), the smaller one is corresponding to tile 49MFT in the MGRS system (regional scale analysis).

The scientific parameters of the Sentinel-2 mission determine a new standard for the utilization of high resolution optical imagery for the study of vegetation and associated phenomena. The detailed spectral range available at high resolution allowed us to implement an adaptive unsupervised
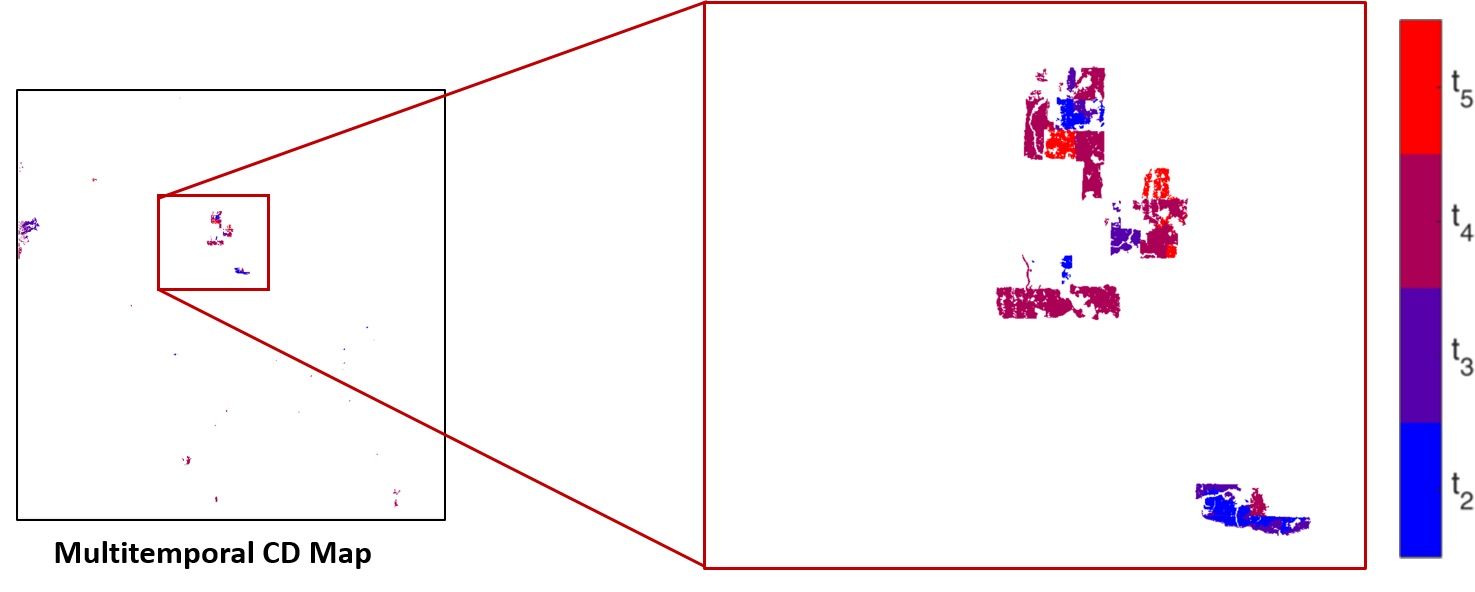
approach based on multivariate CVA that automatically identifies patches of clear cuts on Sentinel-2 image pairs. The proposed multitemporal system is able to process time series and aggregate the results making it possible to both: 1) recover partial loss of information due to cloud coverage, and 2) keep track of the spatial-temporal evolution of the cut patterns.


Time series of Sentinel-2 images over tile 49MFT acquired between December 2015 and April 2017 with cloud coverage less than 50%.

The system takes as input a time series of Sentinel-2 images acquired over the same area, it triggers a separate process for all the possible bitemporal pairs and finally it aggregates the results by returning a “heat” map of the detected changes where the “temperature” is associated to date of detection. At the core of the method there is the capability of estimating the Gaussian parameters of the change class (a transition between vegetation and a specific kind of soil related to the cut) in the bi-temporal stacked domain and to extract all the pixels that belong to its neighborhood.

Theme 3: Land Cover Maps Updating

Problem Formulation:

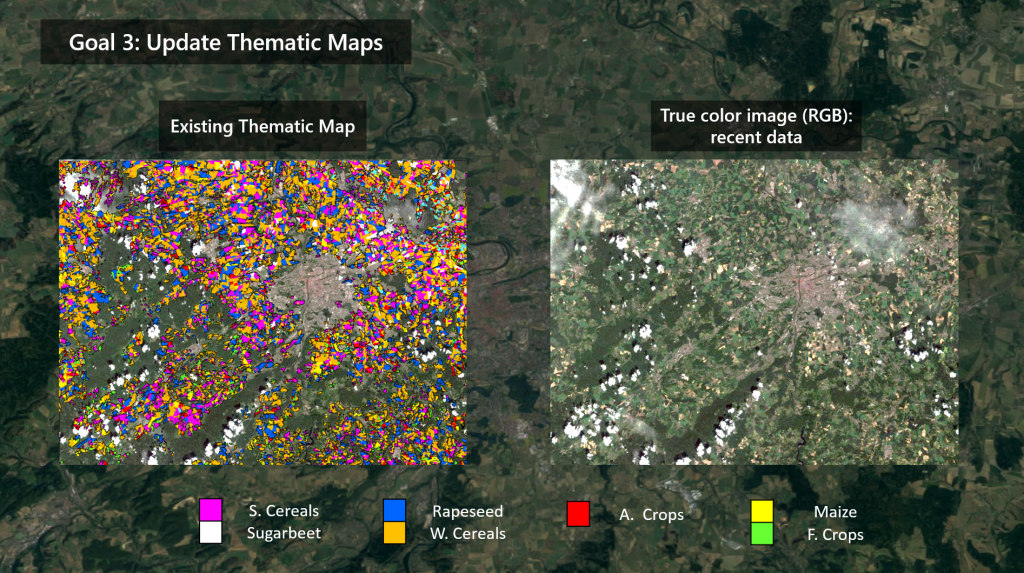
Many techniques have been developed to update maps without ground reference data (unsupervised case). However, all these methods assume to have reference data or a thematic map for at least one image of the time series. Even though this is reasonable in many real applications, it is no longer affordable when considering the need of updating land-cover maps at national or global scale. For this reason, in the last methodological area the time series of S-2 images is employed in order to update an existing thematic land-cover map generated with different RS data by assuming that: i) no reference data are available; ii) the origin of the thematic map to be updated is unknown. Two different cases were analyzed: Phase I. Land Cover Maps updating for crop-types only (Czech Republic); Phase II. Application of Phase I algorithms to update the 2018 Corine Land Cover Map at country level (Italy).

Project Output:

Combining existing thematic vector products and recently acquired satellite images to generate regular updated maps is extremely interesting at operational level. However, employing these maps is not straightforward. Besides the problem of having outdated and possible misclassified maps, dealing with vector land cover maps is an ill-posed problem that has to be accurately modeled.

Phase I

Experiments have been carried out in Czech Republic, by updating a Crop Type Map representing the main cultivations of 2014-2015 in a completely automatic and unsupervised way.
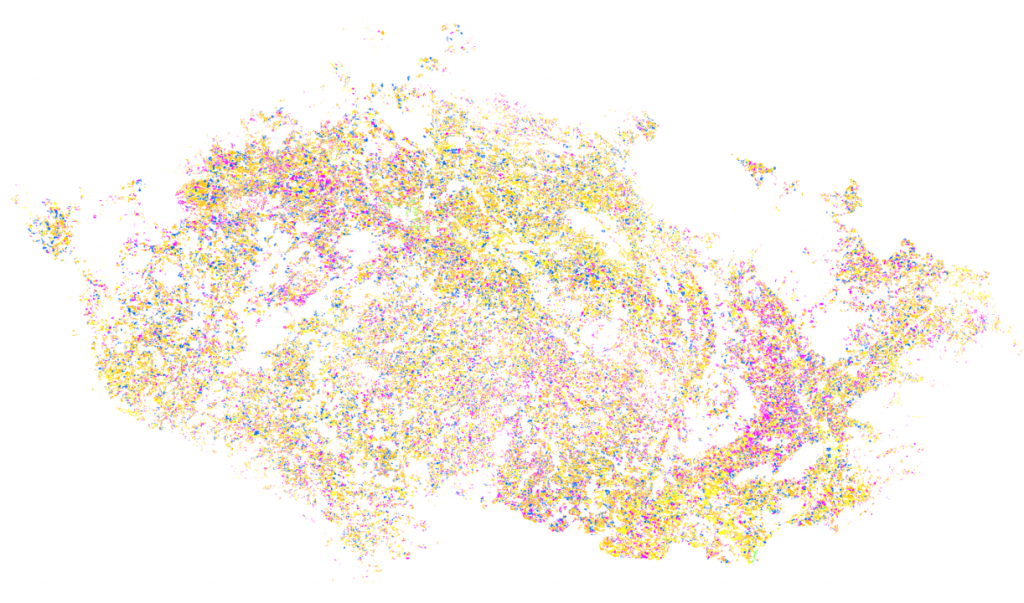

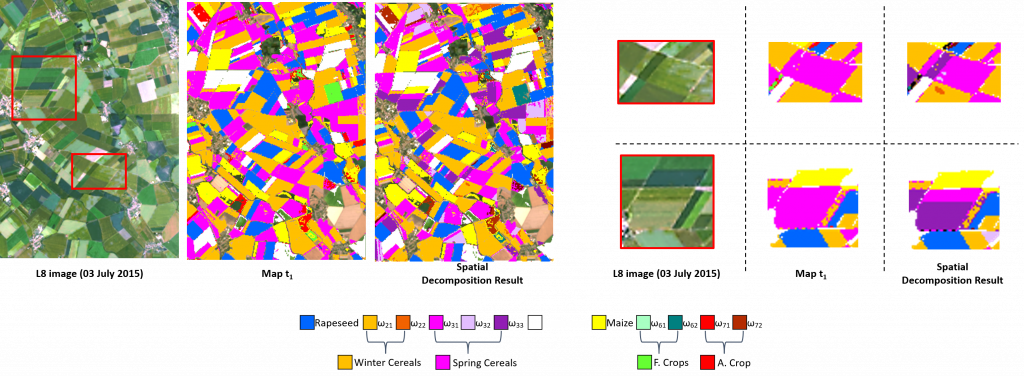
Land Cover Crop Type Map (t1) representing the main cultivations of the Czech Republic for 2014 – 2015.

In this research, we developed a framework that aims to understand and model the LC vector map domain to transfer knowledge for the training of classifiers on recent multispectral data. The first component of the proposed framework performs a spatial decomposition of the considered thematic product, to increase the possibility of identifying pure pixels associated to valid labels (i.e., belonging to the predominant semantic class of the polygon).
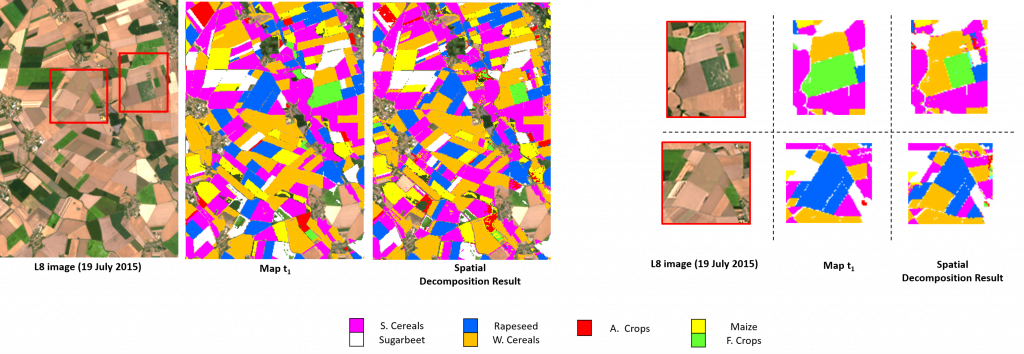
Besides the spatial and pixel decomposition, the map legends usually present semantic-classes (e.g., the “crop” label is assigned to all pixels representing different cultivations, i.e., natural classes). This leads to a semantic gap between the map and the set of natural classes that can be discriminated by the spectral information provided by the remote sensing images. To extract an informative and representative set of labeled samples from the thematic map, the second component of the proposed framework performs a semantic decomposition of the legend map.

Finally, the set of informative labeled samples is used to transfer knowledge from the initial outdated vector map on updated map by classifying a recent time series of Sentinel-2 images.

Phase II

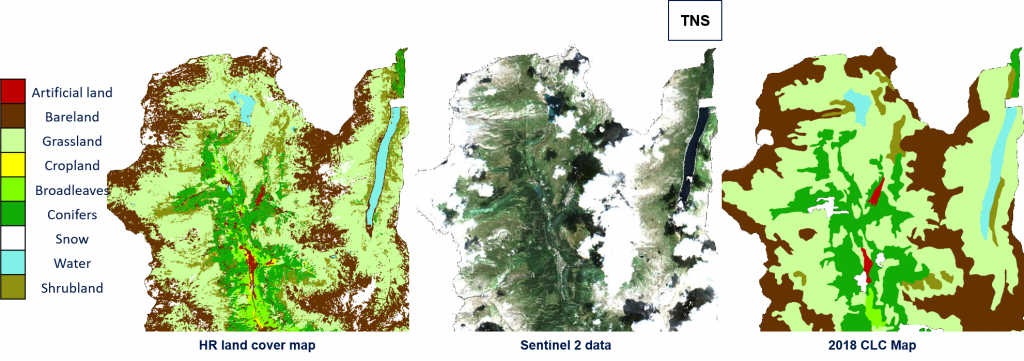
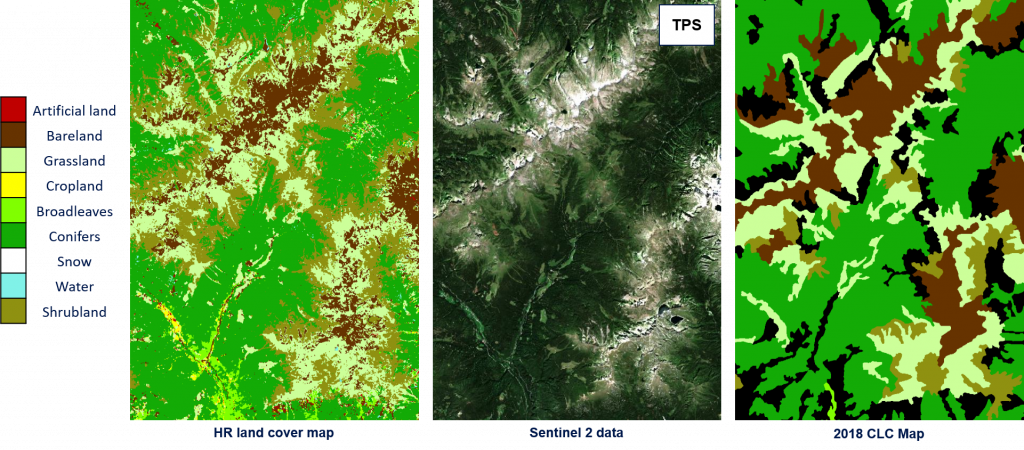
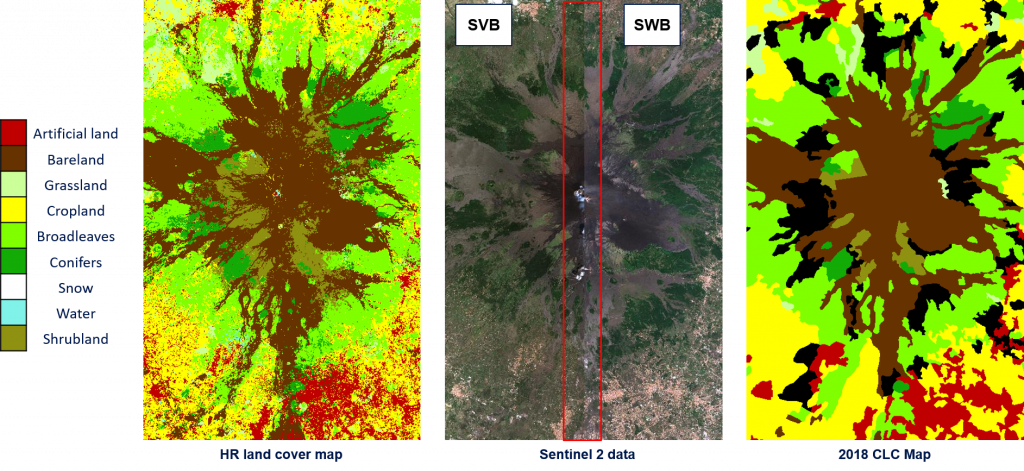
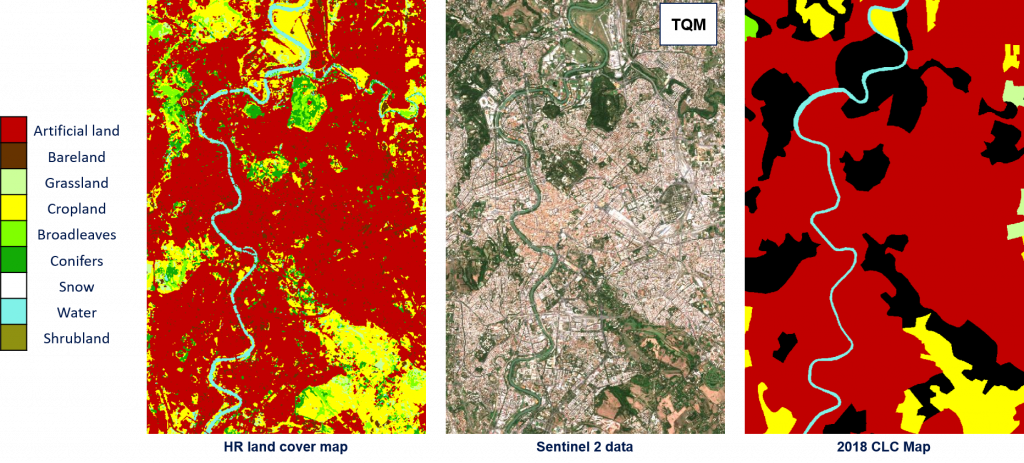
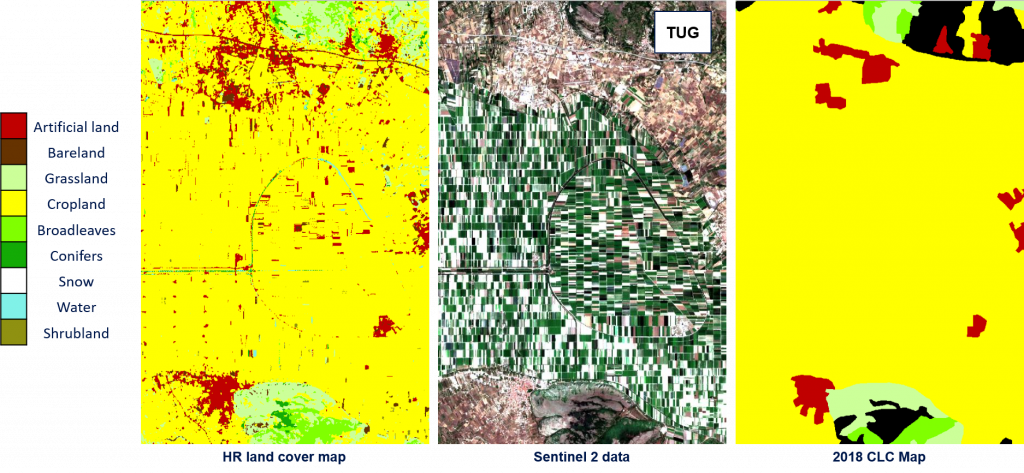
During Phase II the method developed in phase 1 has been employed to generate the High resolution (HR) land cover map (10m spatial resolution) for the whole Italian country (see Figure below). S-2 images have been used to update the CORINE Land Cover Map of 2018 in a completely automatic and unsupervised way. Experiments have been carried out on the 60 Italian tiles by considering 300 S-2 images acquired in the period of April 2018 – October 2018. For validation purposes, the 2018 Land Use and Cover Area frame Statistical survey (LUCAS) database was employed.

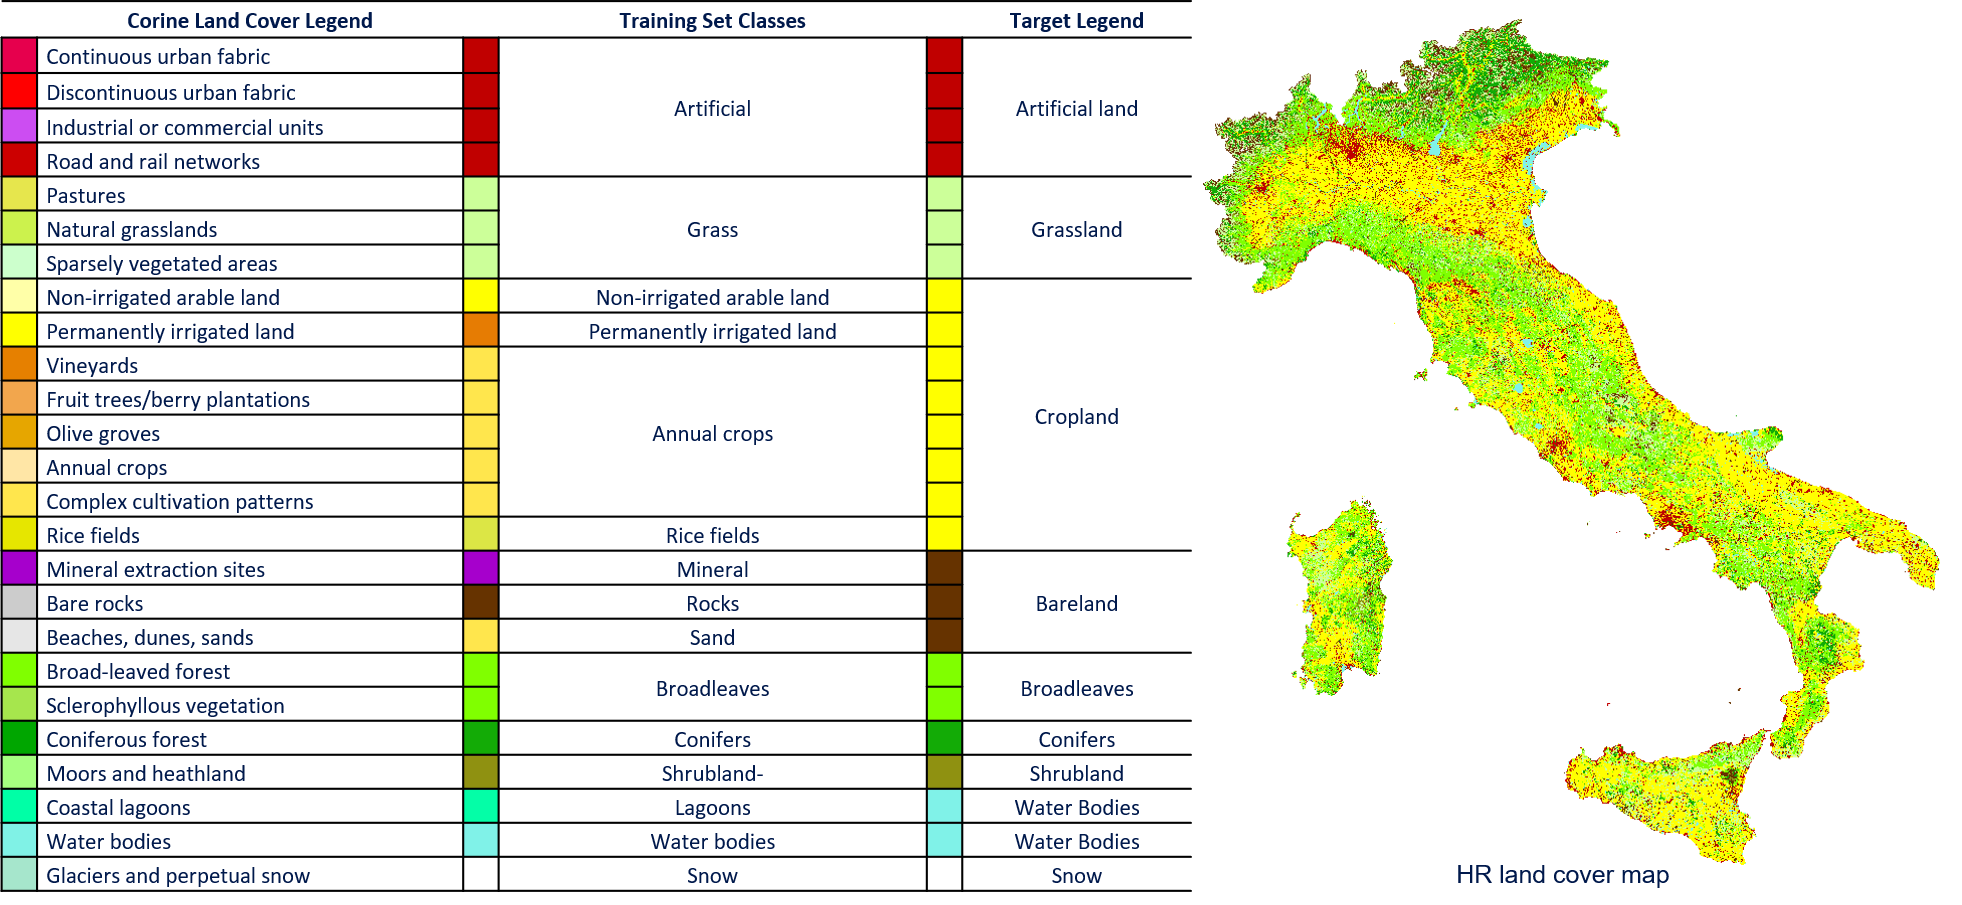
Due to the availability of a detailed hierarchical map legend of the original thematic product, the proposed method can extract training samples from different natural classes in the scene (i.e., “Rice fields“, “Mineral“ and “Sand“) and accurately model the land covers in the desired target legend. The Corine Land Cover classes used to extract a detailed training set are reported below. The classification scheme is finally converted into the desired target legend made up of 9 classes: Artificial Land, Grassland, Cropland, Bareland, Broadleaves, Conifers, Shrubland, Water Bodies and Snow.
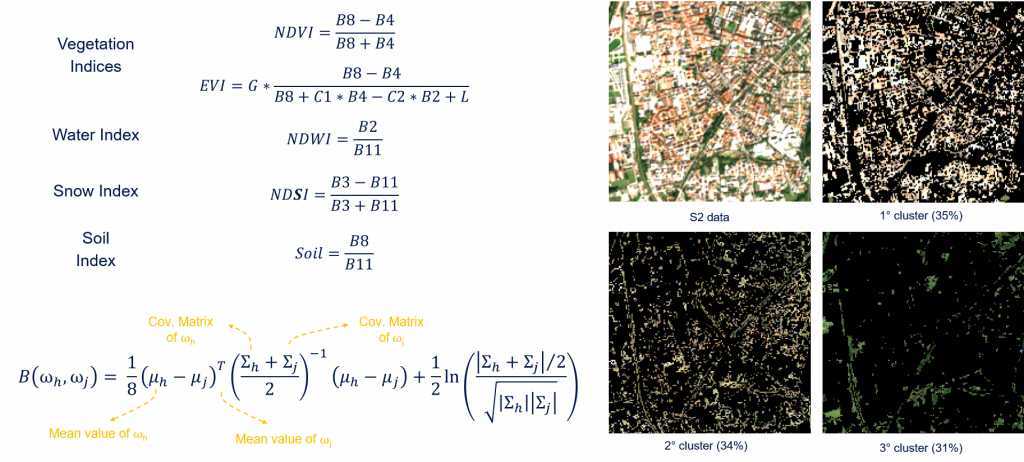
As for Phase I, the goal of system architecture is to extract a reliable “pseudo” training set from the 2018 CLC Map in an unsupervised way by using the S-2 TS of images. The proposed method: (i) automatically identifies and removes the pixels that are likely to be mislabeled; (ii) analyzes the Bhattacharyya distances between the distribution of the classes to automatically check the unsupervised clustering results; and (iii) performs a stratified random sampling to generate a training set proportional to the original prior probability of the classes. The feature space employed to perform the unsupervised clustering analysis (see figures below) and to calculate the Bhattacharyya distances is made up of robust spectral indices (see equation below).
Thanks to the availability of the 2018 LUCAS database, validation was made by comparing the land covers of the HR products and the surveyed LUCAS points. To use as more LUCAS samples as possible for the validation, we took advantage from the land cover and land use classes codes defined per surveyed point (26423 surveyed points used out of 29359). Besides the complexity of the considered operational scenario, the results demonstrate that the method is able to adaptively handle the different landscape and environmental conditions of the whole Italian country by obtaining similar results on the northern, southern, central part of Italy and Italian Islands, and an overall accuracy at country level of 92,21%.
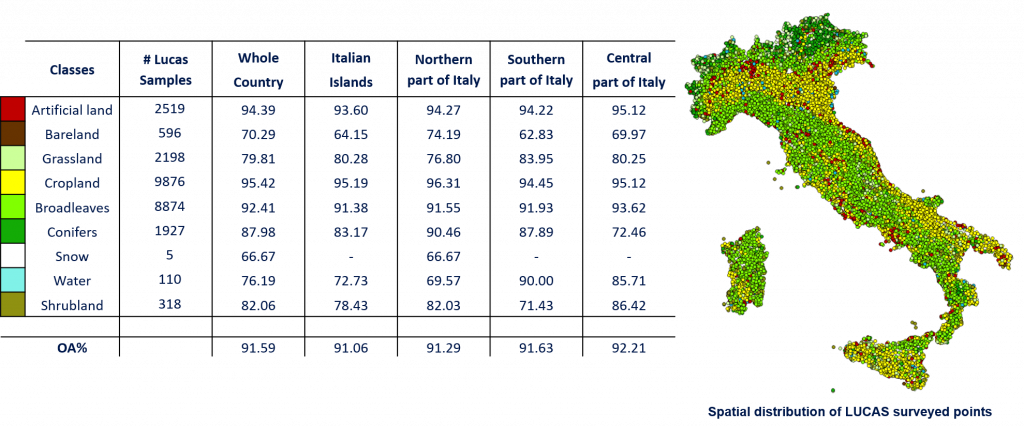
These results are confirmed by the qualitative analysis performed on different S-2 tiles. In the following, some examples are reported.
Request access to project products


    Publications

    Conferences:

    • C. Paris, L. Bruzzone, D. Fernández-Prieto, “A Novel Automatic Approach to the Update of Land-cover Maps by Unsupervised Classification of Remote Sensing Images, ” IEEE International Geoscience and Remote Sensing Symposium (IGARSS), 2017.
    • T. Solano-Correa, F. Bovolo, L. Bruzzone, D. Fernández-Prieto, “Spatio-temporal Evolution of Satellite Image Time Series Acquired by S2 for Crop Field Mapping, ” International Workshop on the Analysis of Multitemporal Remote Sensing Images (MultiTemp), 2017.
    • L. Bruzzone, F. Bovolo, C. Paris, Y. T. Solano-Correa, M. Zanetti, D. Fernández-Prieto, “Analysis of Multitemporal Sentinel-2 Images in the Framework of the ESA Scientific Exploitation of Operational Missions, ” International Workshop on the Analysis of Multitemporal Remote Sensing Images (MultiTemp), 2017.
    • C. Paris, L. Bruzzone, D. Fernández-Prieto, “A novel method based on source domain understanding and modeling to transfer labels from land-cover vector maps to classifiers for multispectral images,” IEEE International Geoscience and Remote Sensing Symposium (IGARSS), 2018.
    • M. Zanetti, L. Bruzzone, D. Fernández-Prieto, “A multivariate change vector analysis system for unsupervised detection of clear-cuts in sentinel-2 time series of the Indonesian forest,” IEEE International Geoscience and Remote Sensing Symposium (IGARSS), 2018.
    • T. Solano-Correa, F. Bovolo, L. Bruzzone, D. Fernández-Prieto, “Automatic Derivation of Cropland Phenological Parameters by Adaptive Non-Parametric Regression of Sentinel-2 NDVI Time Series,” IEEE International Geoscience and Remote Sensing Symposium (IGARSS), 2018.
    • F. Bovolo, L. Bruzzone, D. Fernández-Prieto, C. Paris, Y.T. Solano-Correa, M. Zanetti, “Advanced Methods for the Analysis of Multitemporal Sentinel 2 Images,” Abstract in 2nd GTTI Radar and Remote Sensing Workshop 2018, Pavia, Italy, 28-29 May 2018.
    • T. Solano-Correa, F. Bovolo, L. Bruzzone, D. Fernández-Prieto, “Spatio-Temporal Evolution of Crop Fields in Sentinel-2 Satellite Image Time Series,” Abstract in ESA Living Planet Symposium (LPS). Milan (Italy), May 13-17 2019.
    • T. Solano-Correa, F. Bovolo, L. Bruzzone, “A Semi-supervised Crop-type Classification Based on Sentinel-2 NDVI Satellite Image Time Series and Phenological Parameters,” IEEE International Geoscience and Remote Sensing Symposium (IGARSS), 2019.
    • F. Bovolo, L. Bruzzone, D. Fernández-Prieto, C. Paris, Y. T. Solano-Correa, E. Volden, M. Zanetti, ”Big Data from Space for Precision Agriculture Applications,” Abstract in 11th International Symposium of Digital Earth (ISDE), Florence, Italy, September 24-27 2019.

    Journals:

    • C. Paris, L. Bruzzone, D. Fernández-Prieto, “A Novel Approach to the Unsupervised Update of Land-Cover Maps by Classification of Time Series of Multispectral Images,” IEEE Transactions on Geoscience and Remote Sensing, Vol. 57, No. 7, pp. 4259-4277, 2019.
    • Y. T. Solano-Correa, F. Bovolo, L. Bruzzone, D. Fernández-Prieto, “Spatio-temporal evolution of crop fields in Sentinel-2 Satellite Image Time Series,” IEEE Transactions on Geoscience and Remote Sensing, Vol. 58, pp. 2150-2164, 2020.

    Project Team

    The partnership of the MTA project supported by ESA is led by the Remote Sensing Laboratory (RSLab) at the Department of Information Engineering and Computer Science of the University of Trento (UoT) and involves the Remote Sensing for Digital Earth Unit at the Fondazione Bruno Kessler (FBK) research center.

    The RSLab coordinated by Prof. Lorenzo Bruzzone has a huge know-how on the definition, implementation and application of techniques and algorithms for the analysis of multitemporal images. RSLab has a widely recognized leadership in multitemporal data analysis and processing of time series in terms of change detection, and analysis of long time series and updating of land-cover maps. This is demonstrated by the quantity of RSLab publications on these specific topics (and their quality proven by citations), by the projects/applications managed by the group, and by the many initiative related to the temporal variable in remote sensing RSLab has managed. RSLab is the Prime Contractor of this proposal and has the scientific responsibility of the analysis of the state-of-the art, of selecting/defining the most effective methods and algorithms to be implemented in order to satisfy the requirements of the call, and of defining the road map for future activities. RSLab will then contribute to the implementation and to the validation of the algorithms.

    The RSDE is an application oriented research group developed within the internationally well-known FBK research center. This Unit is built around the large know of the leader (Dr. Francesca Bovolo) in RS, who is a top expert in the field of multitemporal data analysis. RSDE in the project will lead the implementation, testing and validation of the developed tools on S-2 multitemporal datasets taking into account the large expertise and computation infrastructure the center has on the processing of large quantity of data. Moreover RSDE will contribute to the selection and implementation of the algorithms and to the definition of the road map.