Project Output:
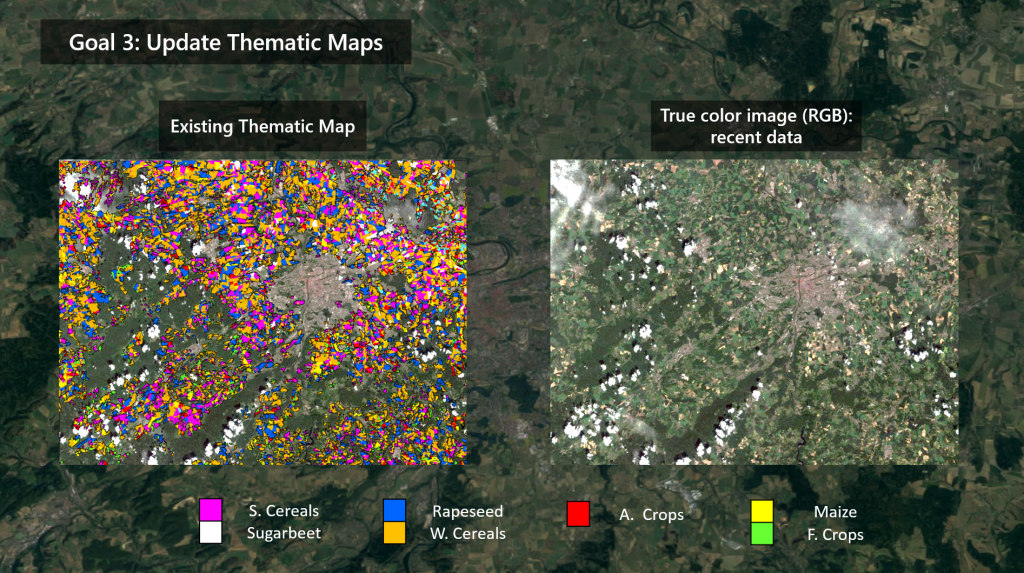
Combining existing thematic vector products and recently acquired satellite images to generate regular updated maps is extremely interesting at operational level. However, employing these maps is not straightforward. Besides the problem of having outdated and possible misclassified maps, dealing with vector land cover maps is an ill-posed problem that has to be accurately modeled.
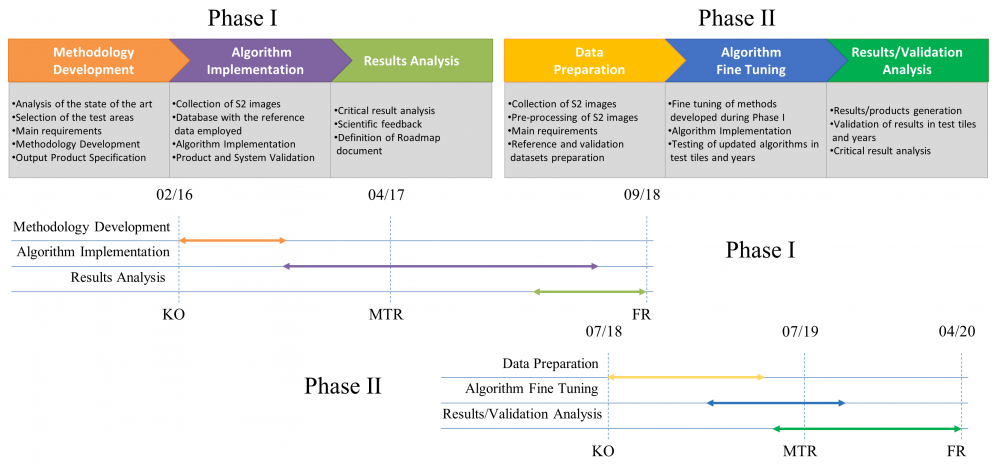
Phase I
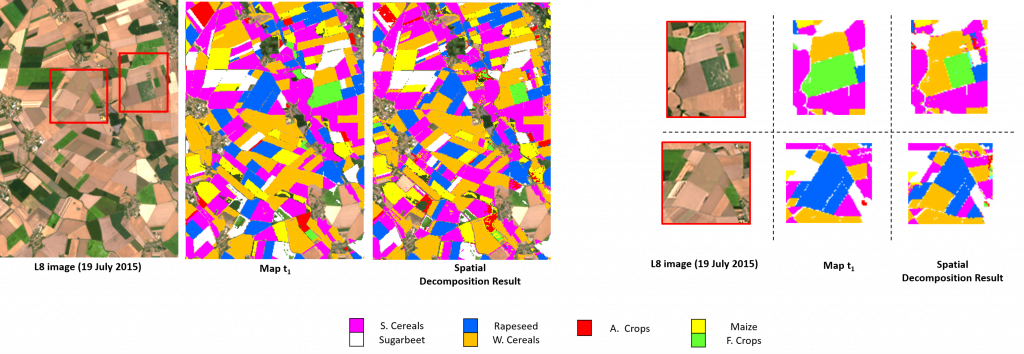
Experiments have been carried out in Czech Republic, by updating a Crop Type Map representing the main cultivations of 2014-2015 in a completely automatic and unsupervised way.
Land Cover Crop Type Map (t1) representing the main cultivations of the Czech Republic for 2014 – 2015.
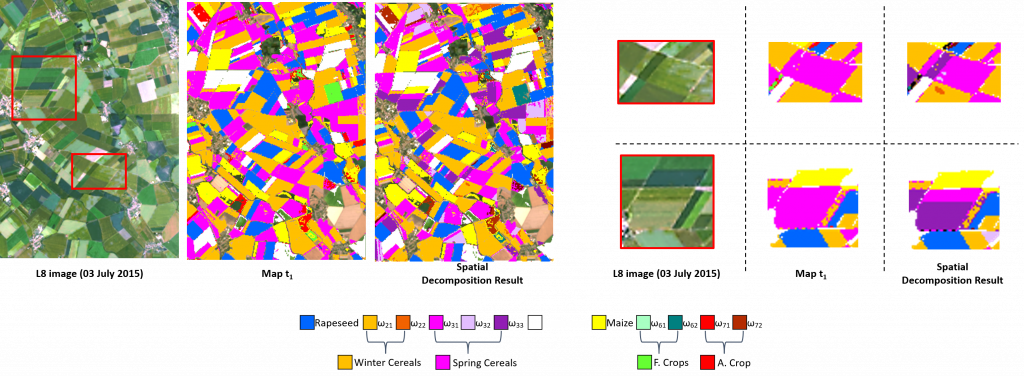
In this research, we developed a framework that aims to understand and model the LC vector map domain to transfer knowledge for the training of classifiers on recent multispectral data. The first component of the proposed framework performs a spatial decomposition of the considered thematic product, to increase the possibility of identifying pure pixels associated to valid labels (i.e., belonging to the predominant semantic class of the polygon).
Besides the spatial and pixel decomposition, the map legends usually present semantic-classes (e.g., the “crop” label is assigned to all pixels representing different cultivations, i.e., natural classes). This leads to a semantic gap between the map and the set of natural classes that can be discriminated by the spectral information provided by the remote sensing images. To extract an informative and representative set of labeled samples from the thematic map, the second component of the proposed framework performs a semantic decomposition of the legend map.
Finally, the set of informative labeled samples is used to transfer knowledge from the initial outdated vector map on updated map by classifying a recent time series of Sentinel-2 images.
Phase II
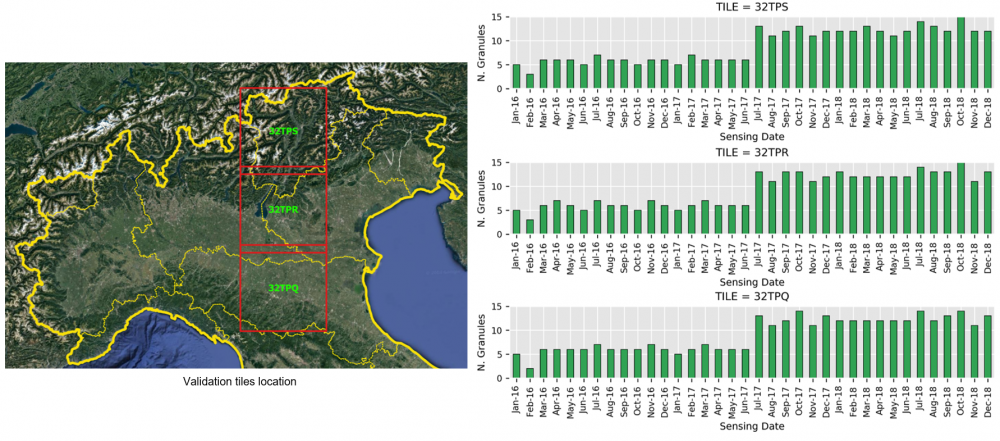
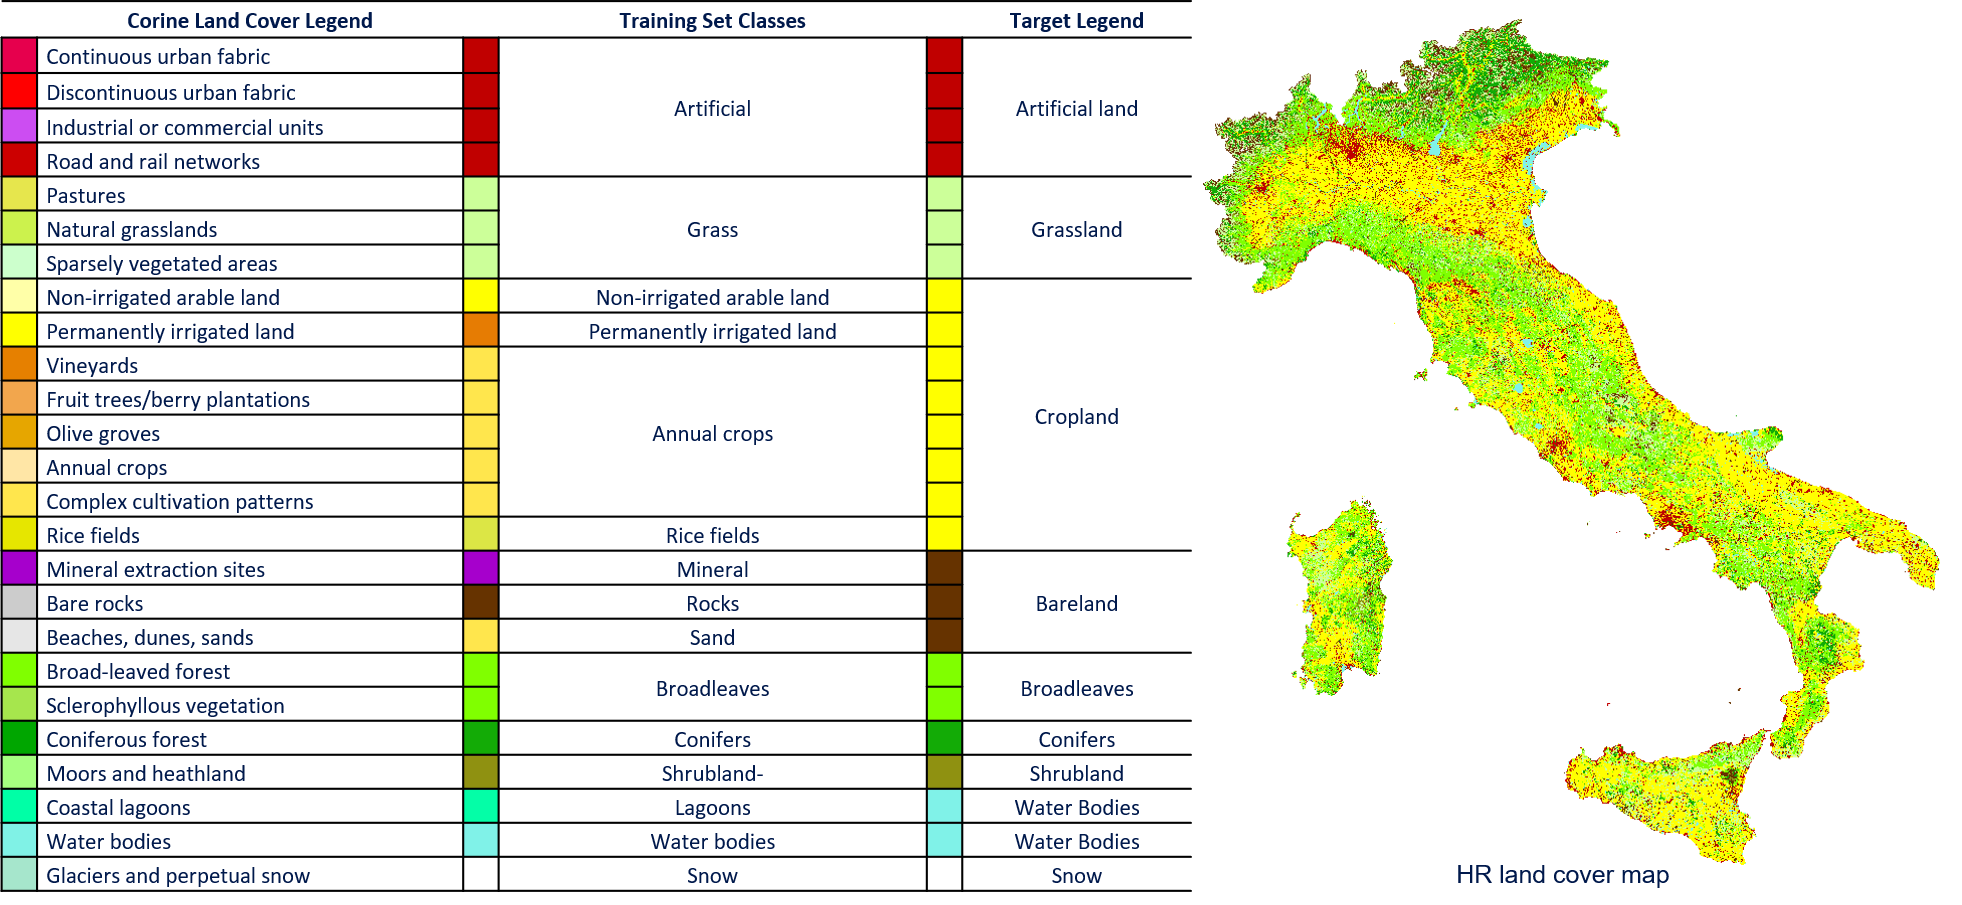
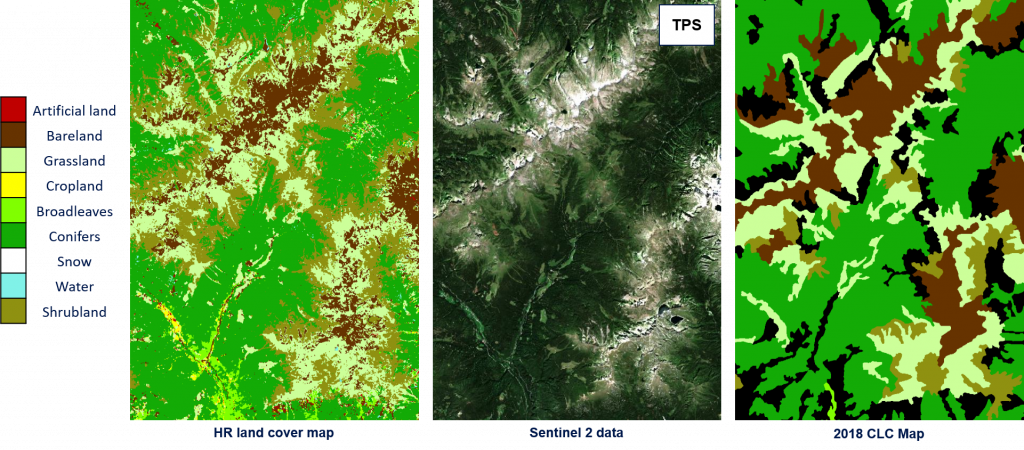
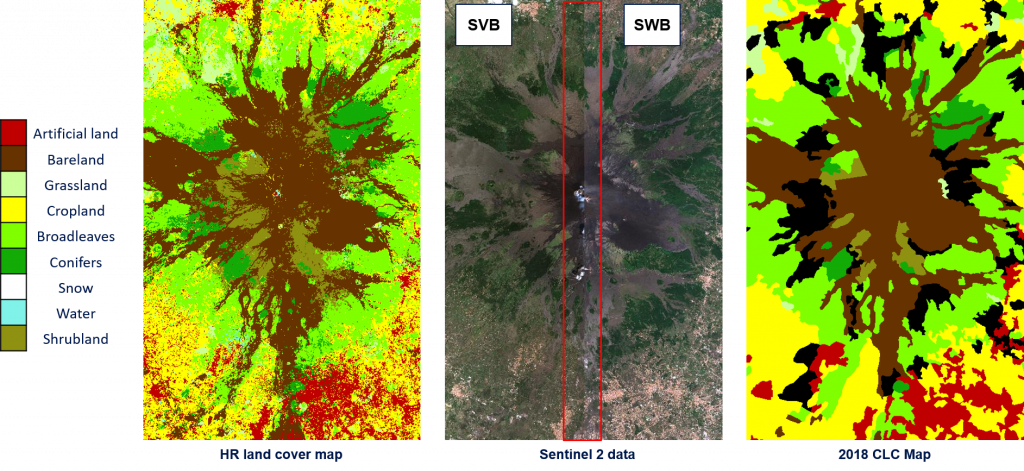
During Phase II the method developed in phase 1 has been employed to generate the High resolution (HR) land cover map (10m spatial resolution) for the whole Italian country (see Figure below). S-2 images have been used to update the CORINE Land Cover Map of 2018 in a completely automatic and unsupervised way. Experiments have been carried out on the 60 Italian tiles by considering 300 S-2 images acquired in the period of April 2018 – October 2018. For validation purposes, the 2018 Land Use and Cover Area frame Statistical survey (LUCAS) database was employed.
Due to the availability of a detailed hierarchical map legend of the original thematic product, the proposed method can extract training samples from different natural classes in the scene (i.e., “Rice fields“, “Mineral“ and “Sand“) and accurately model the land covers in the desired target legend. The Corine Land Cover classes used to extract a detailed training set are reported below. The classification scheme is finally converted into the desired target legend made up of 9 classes: Artificial Land, Grassland, Cropland, Bareland, Broadleaves, Conifers, Shrubland, Water Bodies and Snow.
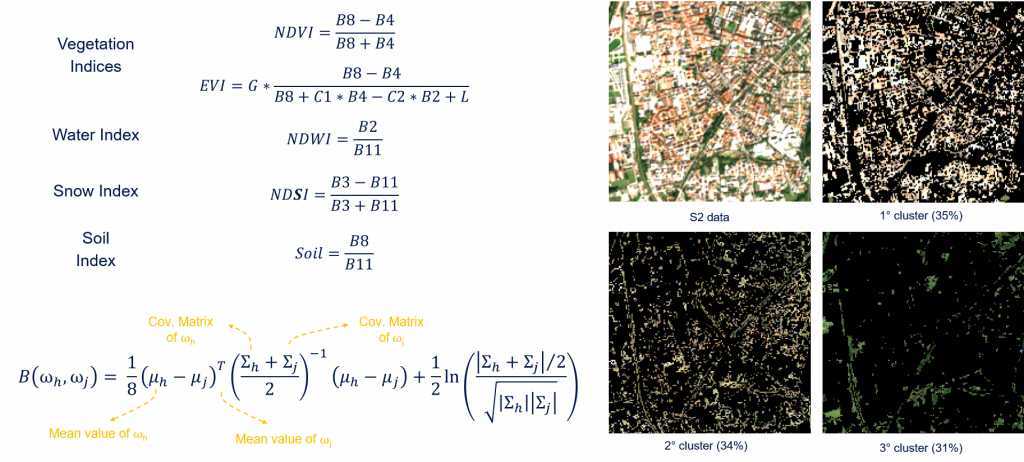
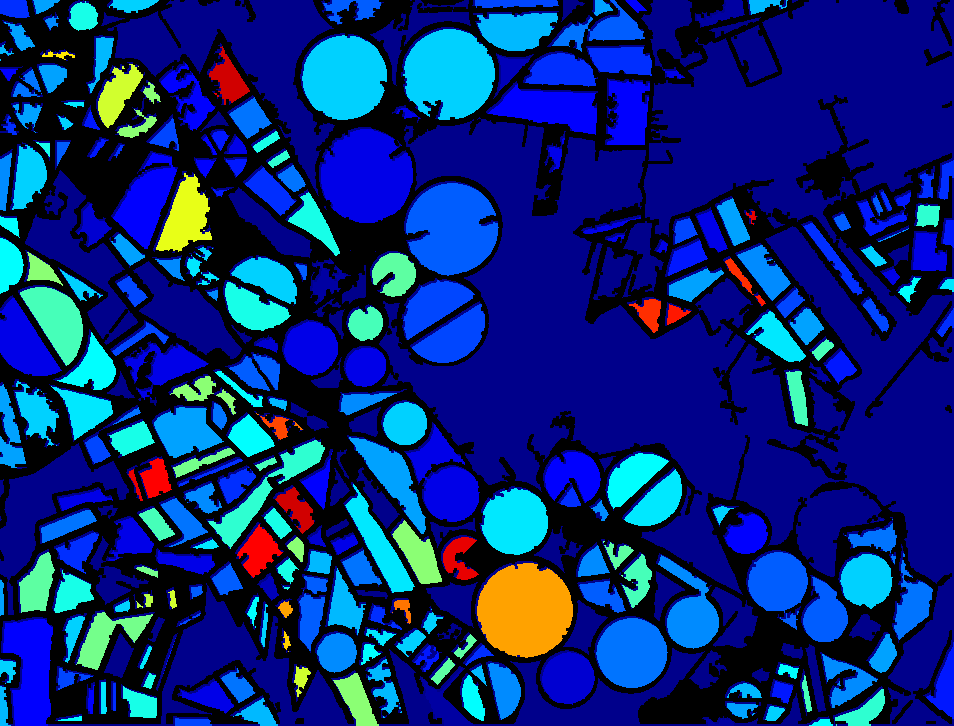
As for Phase I, the goal of system architecture is to extract a reliable “pseudo” training set from the 2018 CLC Map in an unsupervised way by using the S-2 TS of images. The proposed method: (i) automatically identifies and removes the pixels that are likely to be mislabeled; (ii) analyzes the Bhattacharyya distances between the distribution of the classes to automatically check the unsupervised clustering results; and (iii) performs a stratified random sampling to generate a training set proportional to the original prior probability of the classes. The feature space employed to perform the unsupervised clustering analysis (see figures below) and to calculate the Bhattacharyya distances is made up of robust spectral indices (see equation below).
Thanks to the availability of the 2018 LUCAS database, validation was made by comparing the land covers of the HR products and the surveyed LUCAS points. To use as more LUCAS samples as possible for the validation, we took advantage from the land cover and land use classes codes defined per surveyed point (26423 surveyed points used out of 29359). Besides the complexity of the considered operational scenario, the results demonstrate that the method is able to adaptively handle the different landscape and environmental conditions of the whole Italian country by obtaining similar results on the northern, southern, central part of Italy and Italian Islands, and an overall accuracy at country level of 92,21%.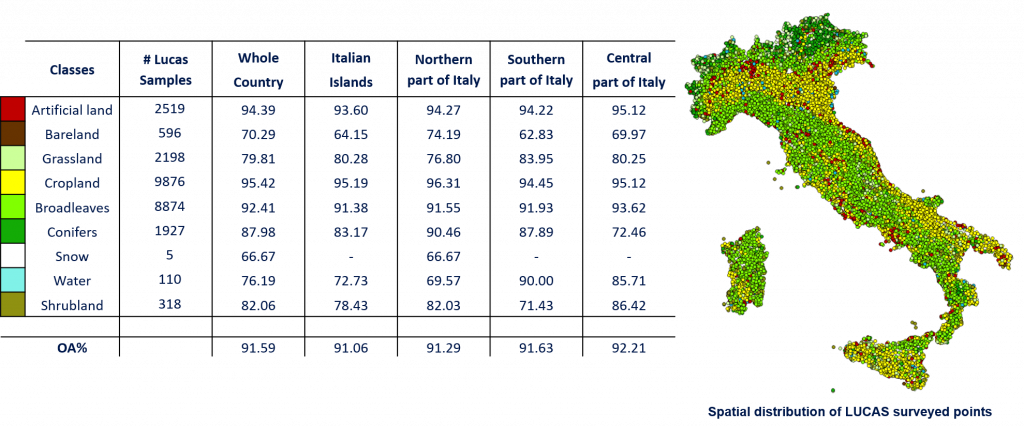
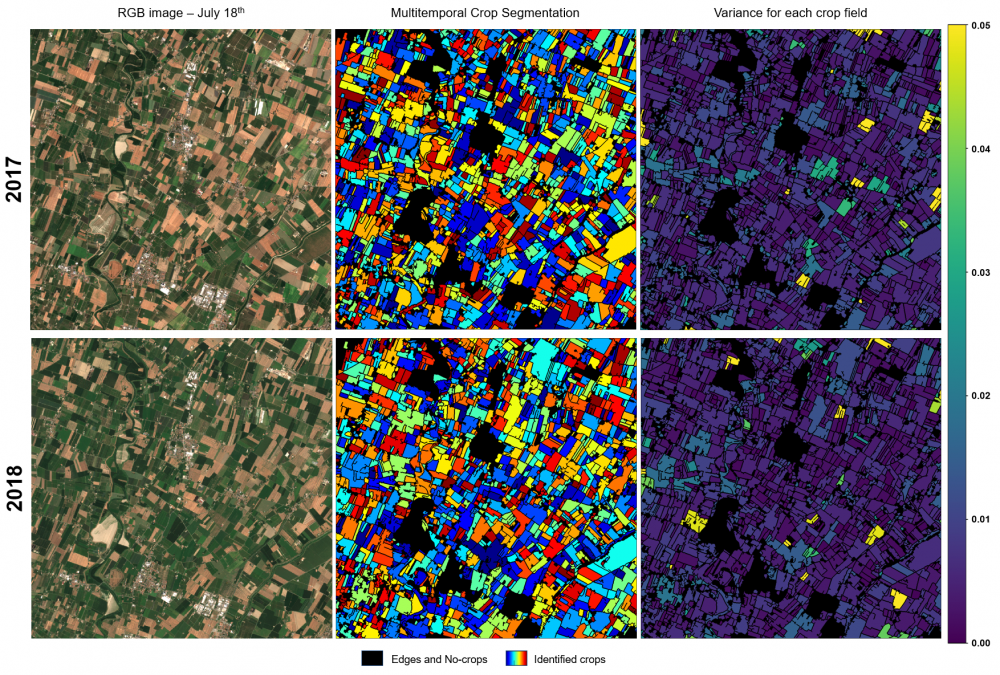
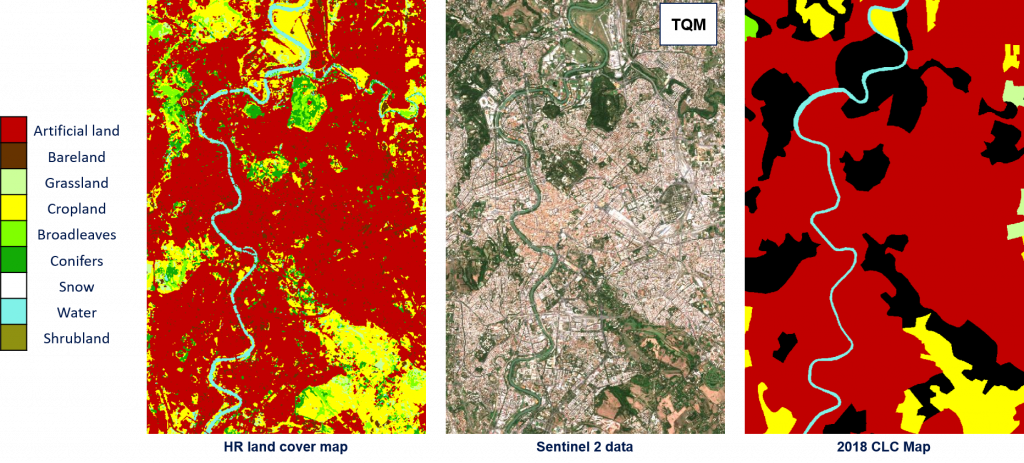
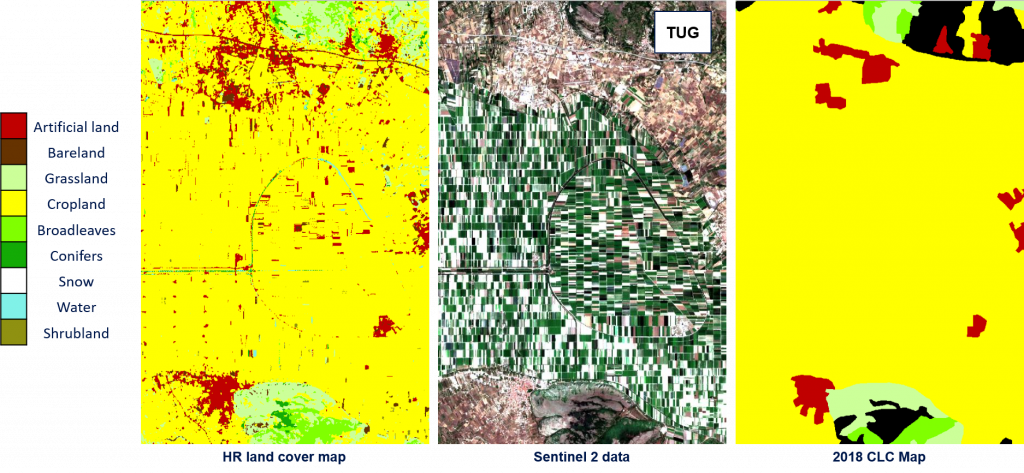
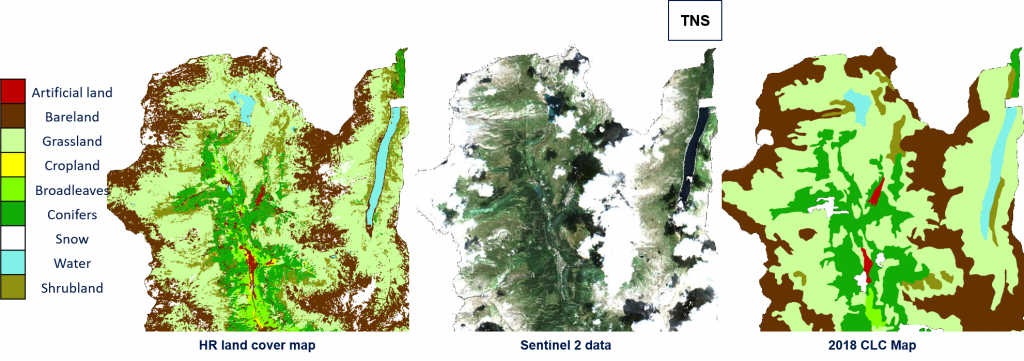
These results are confirmed by the qualitative analysis performed on different S-2 tiles. In the following, some examples are reported.


 RGB images
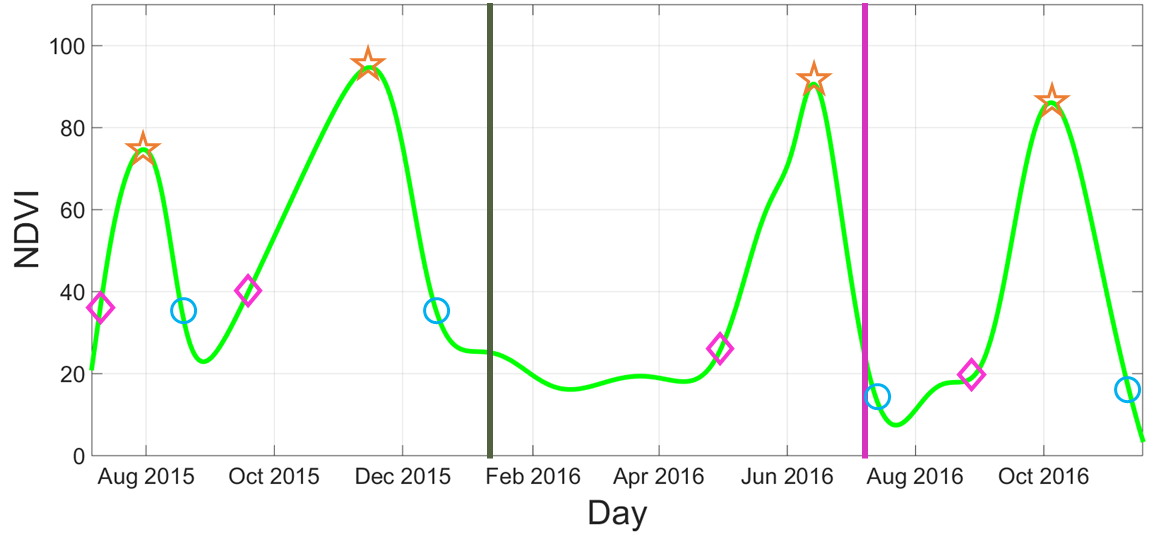
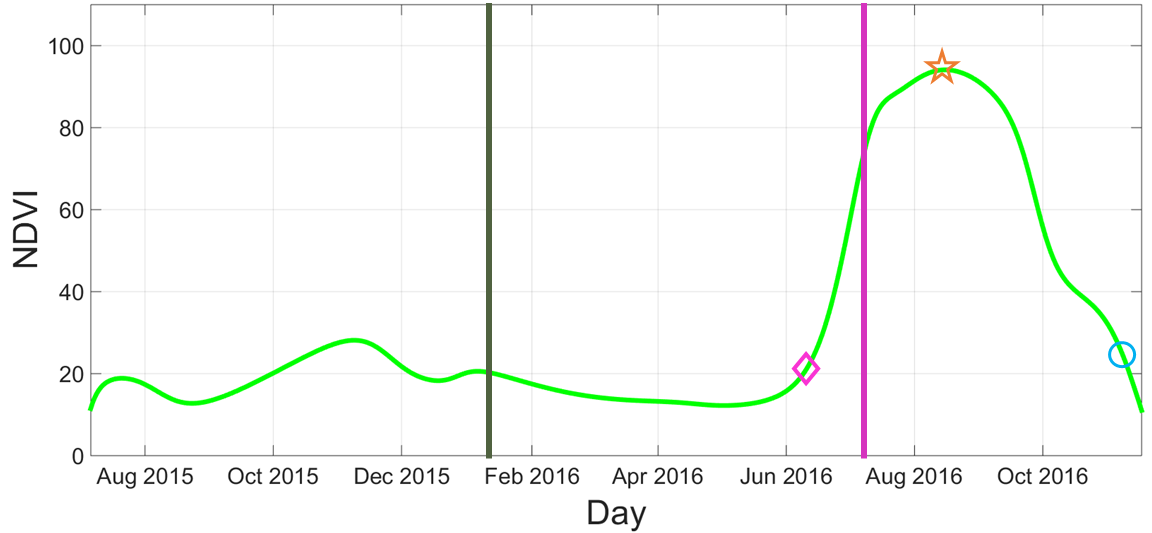
 Normalized Difference Vegetation Index (NDVI)
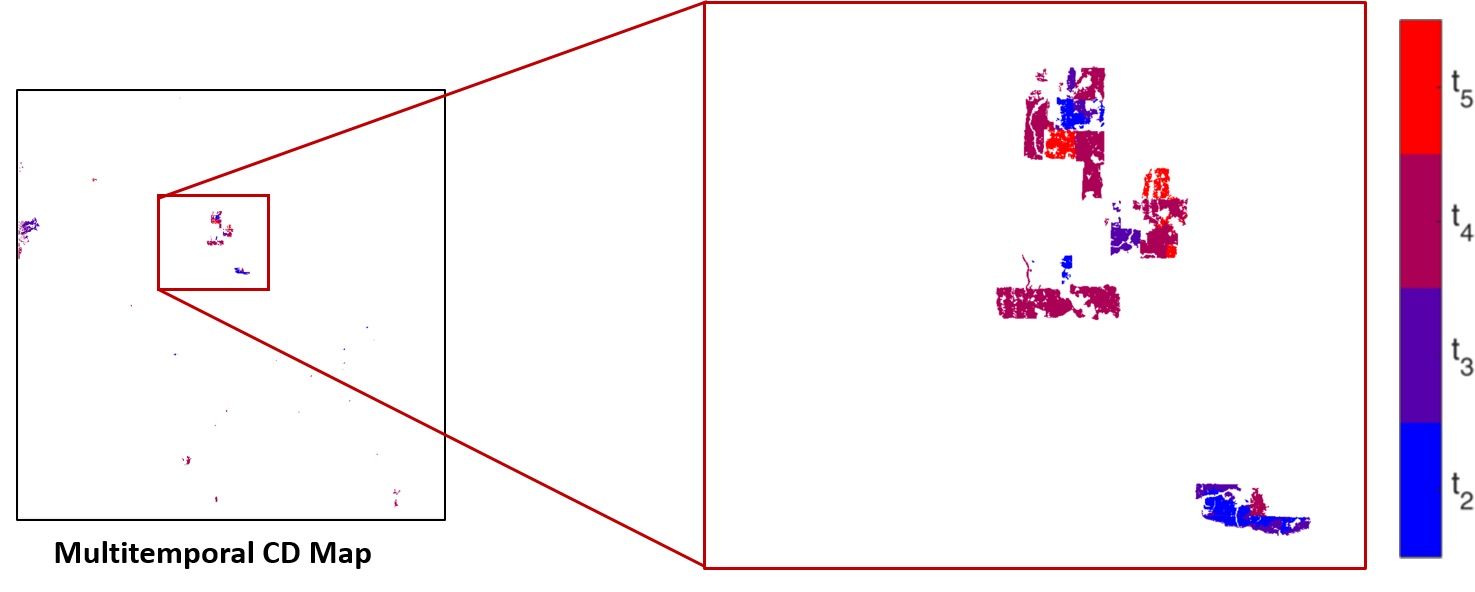
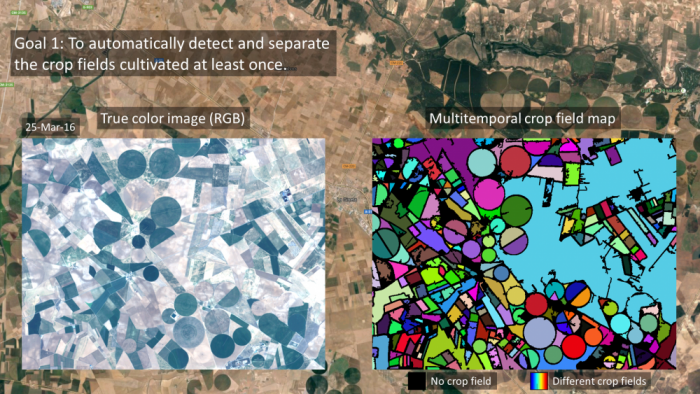
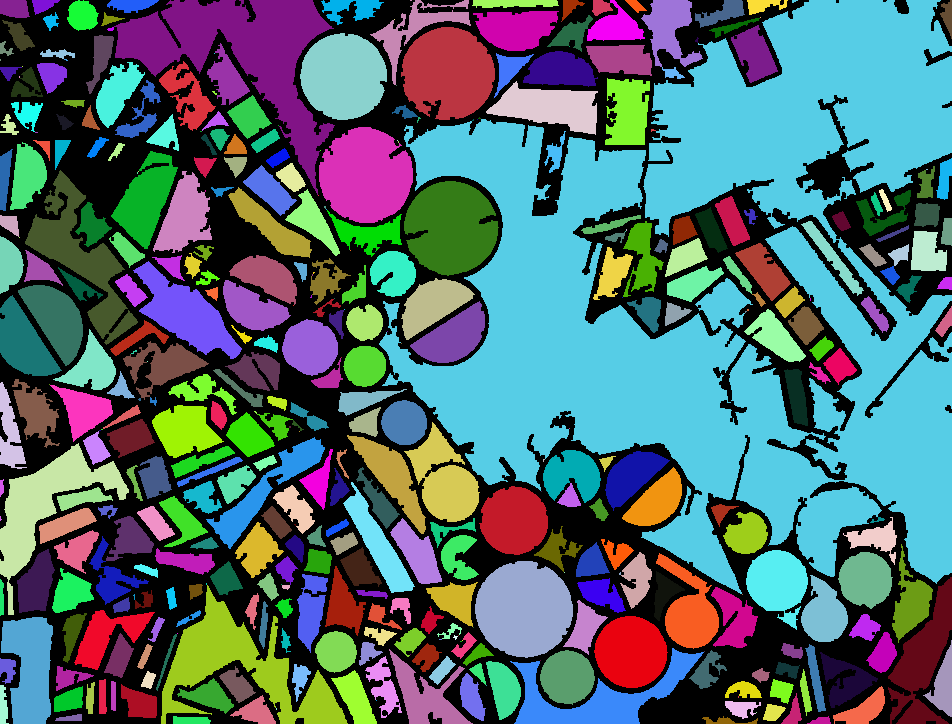 Multitemporal crop field map
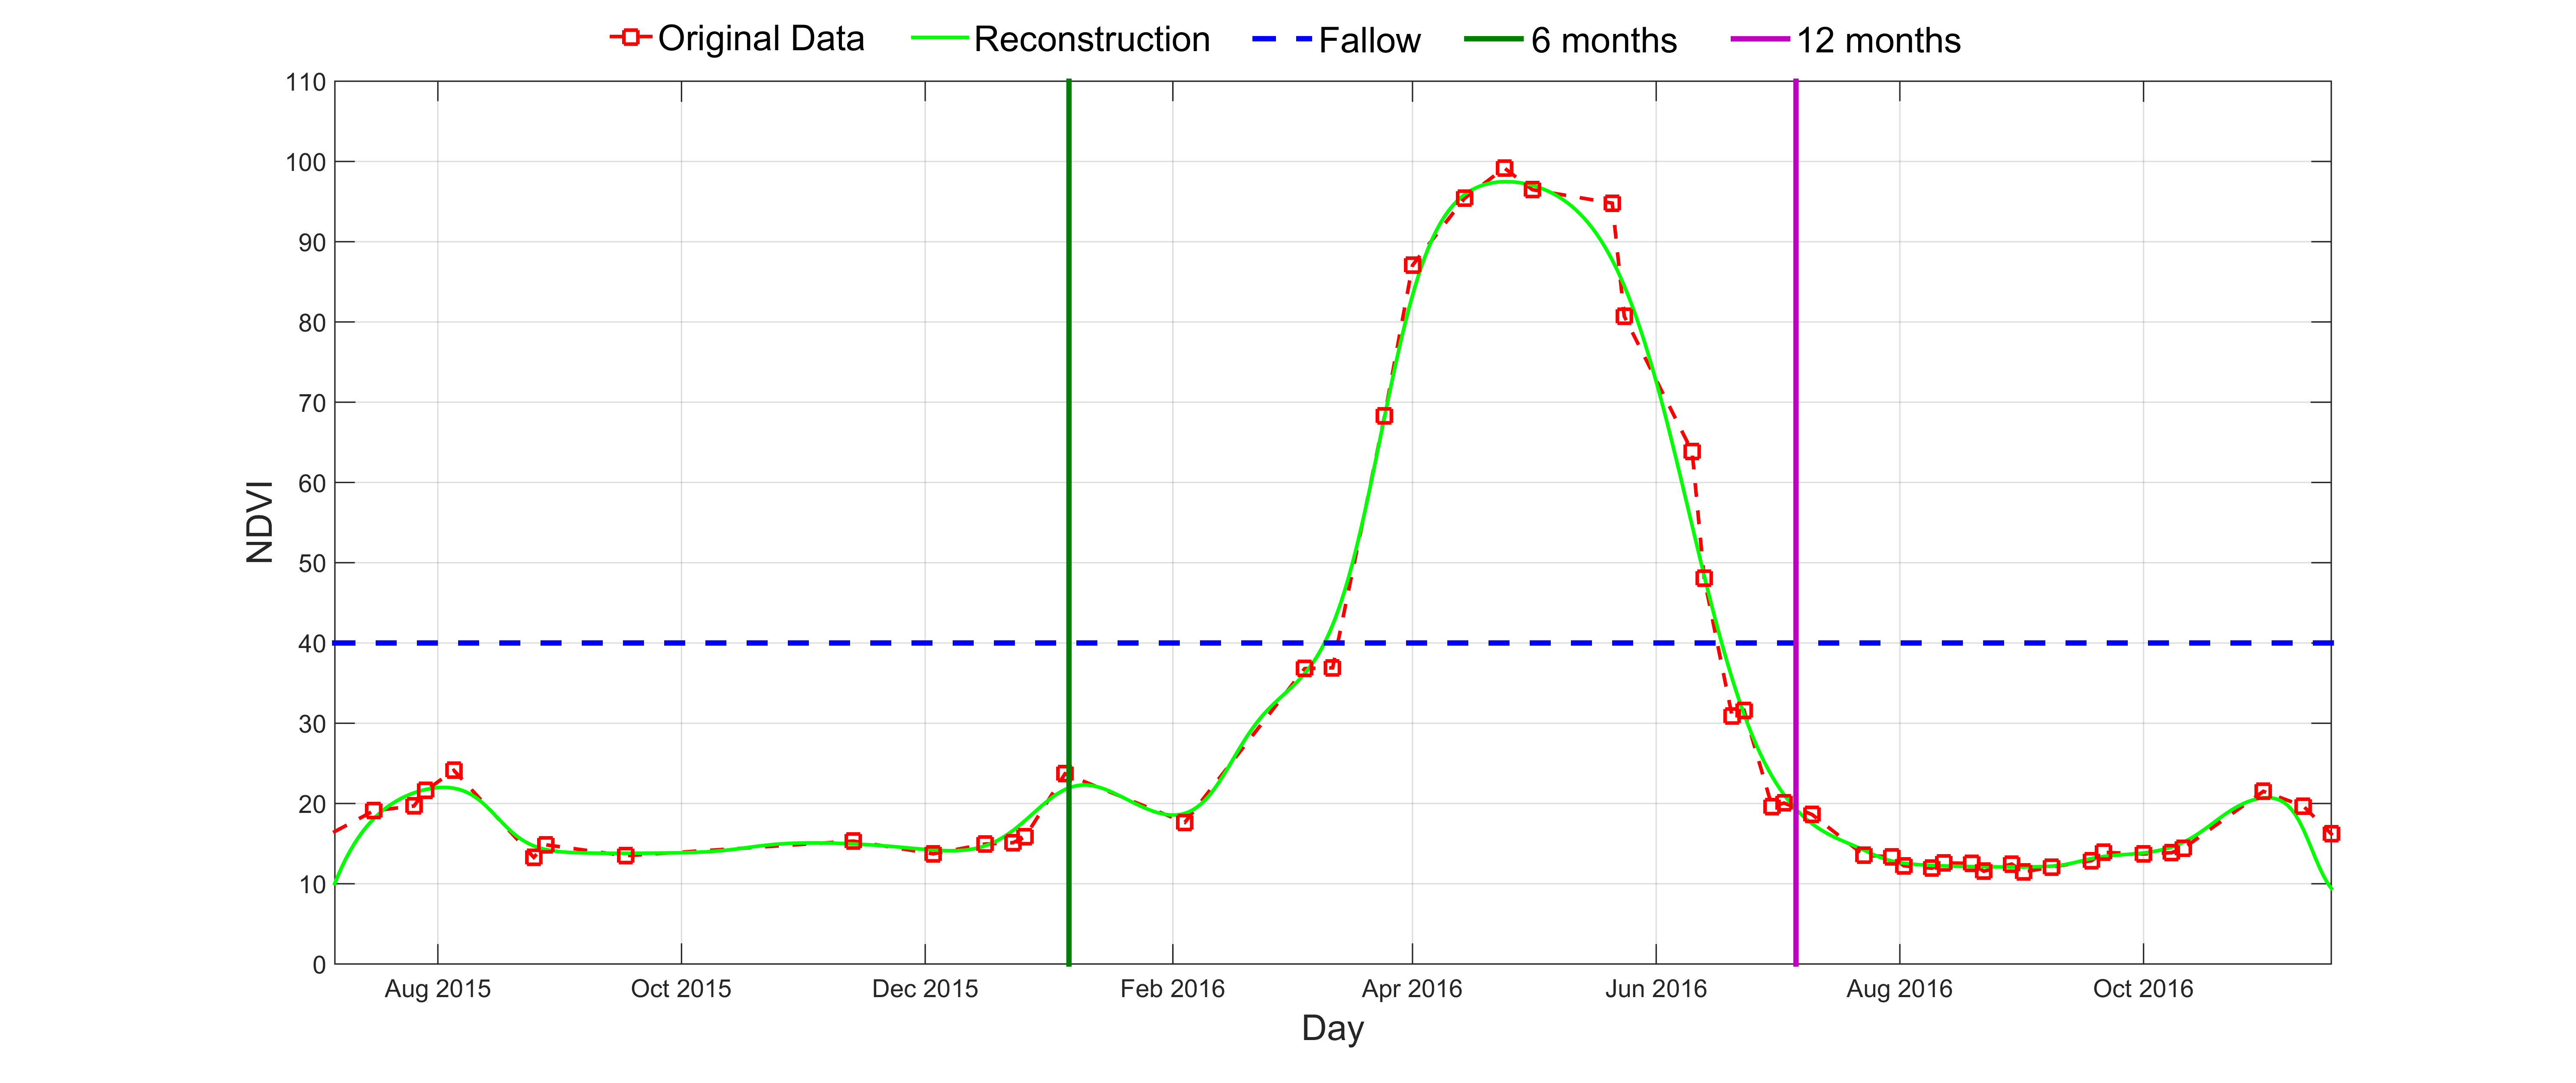

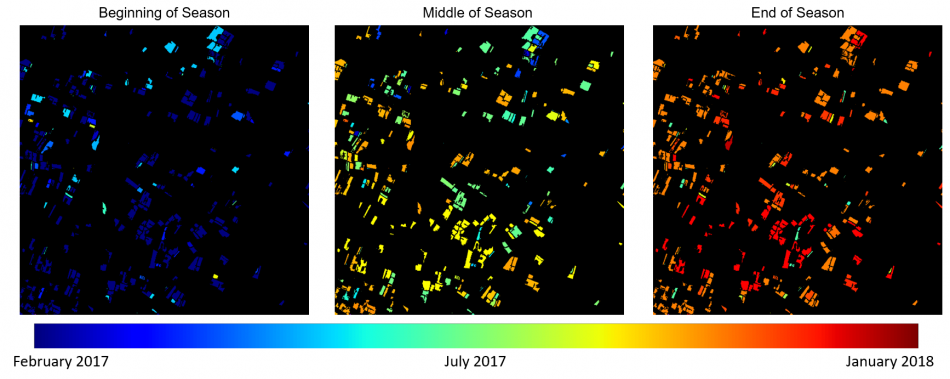
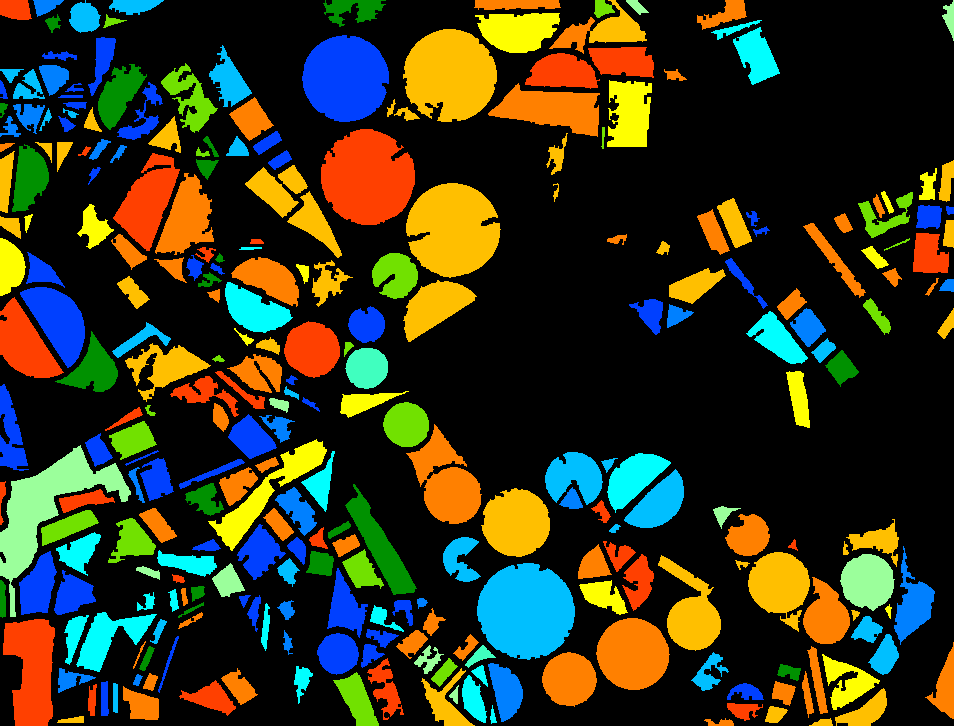 Beginning of season
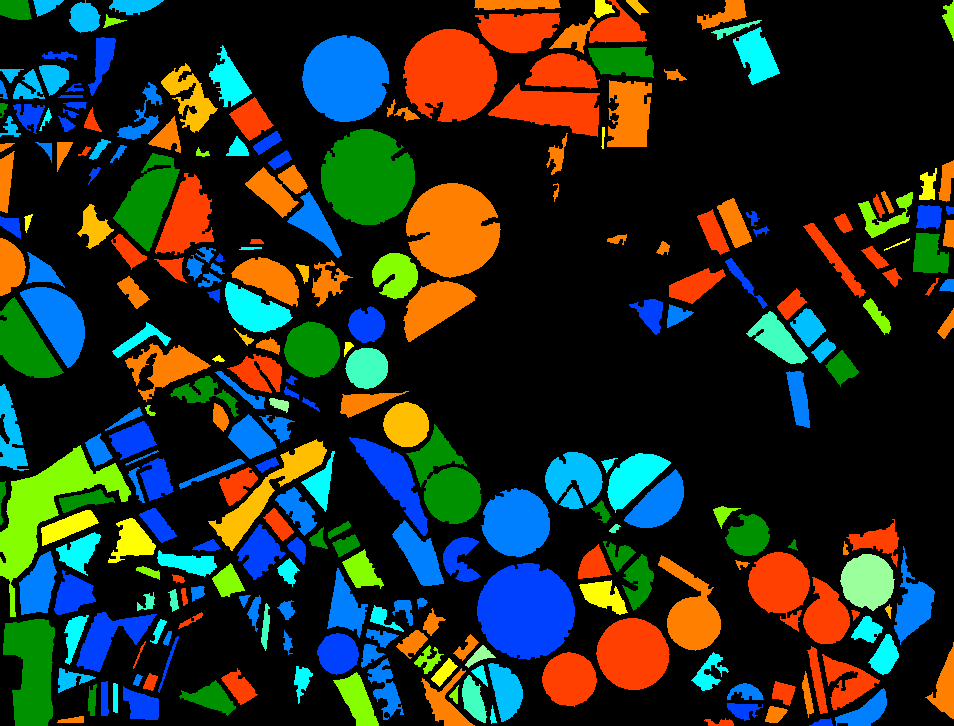 Middle of season
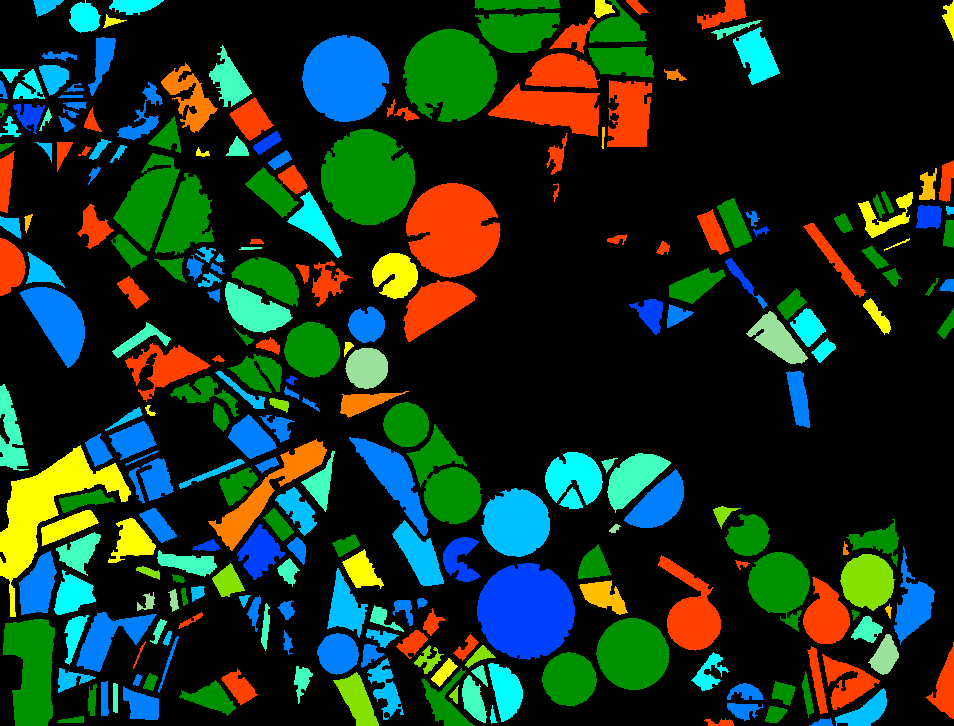 End of season
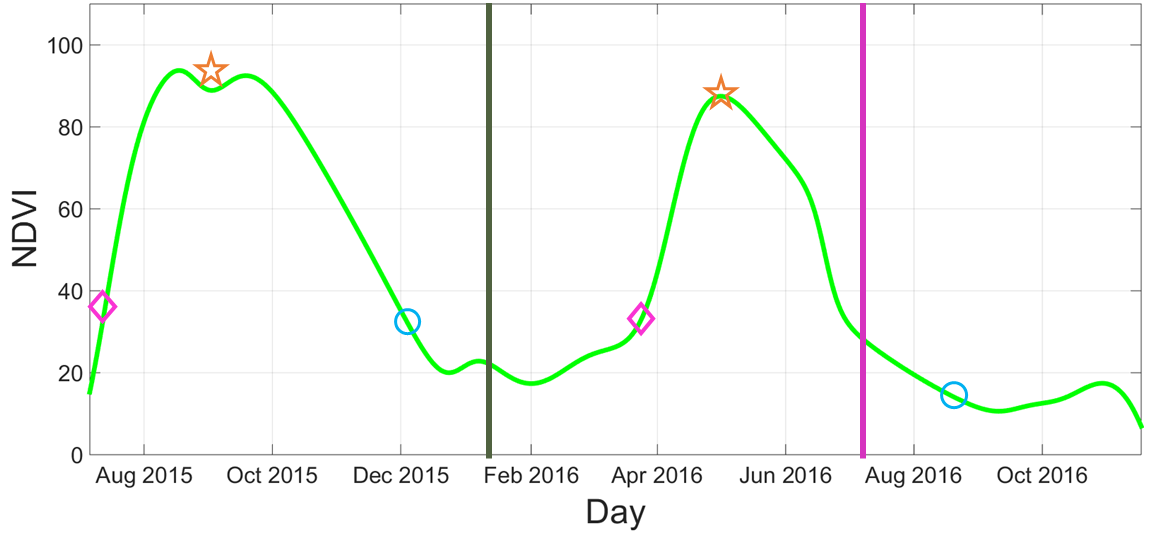

 Cumulative NDVI
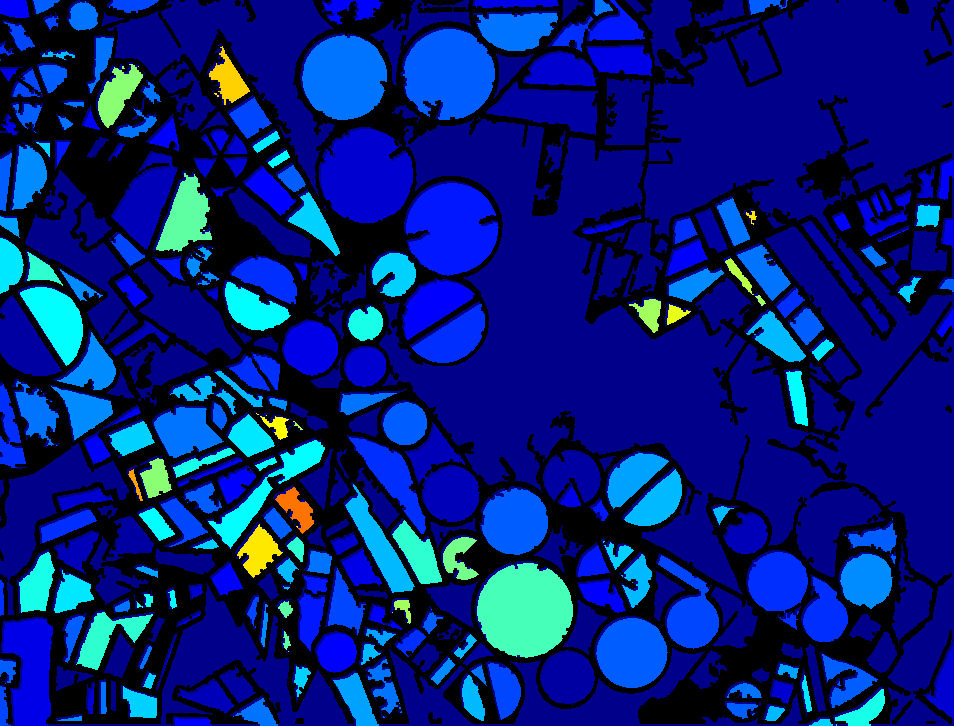 Cumulative NDWI