This project has received funding from the European Union’s Horizon 2020 research and innovation programme under the Marie Sklodowska-Curie grant agreement No 101028085.
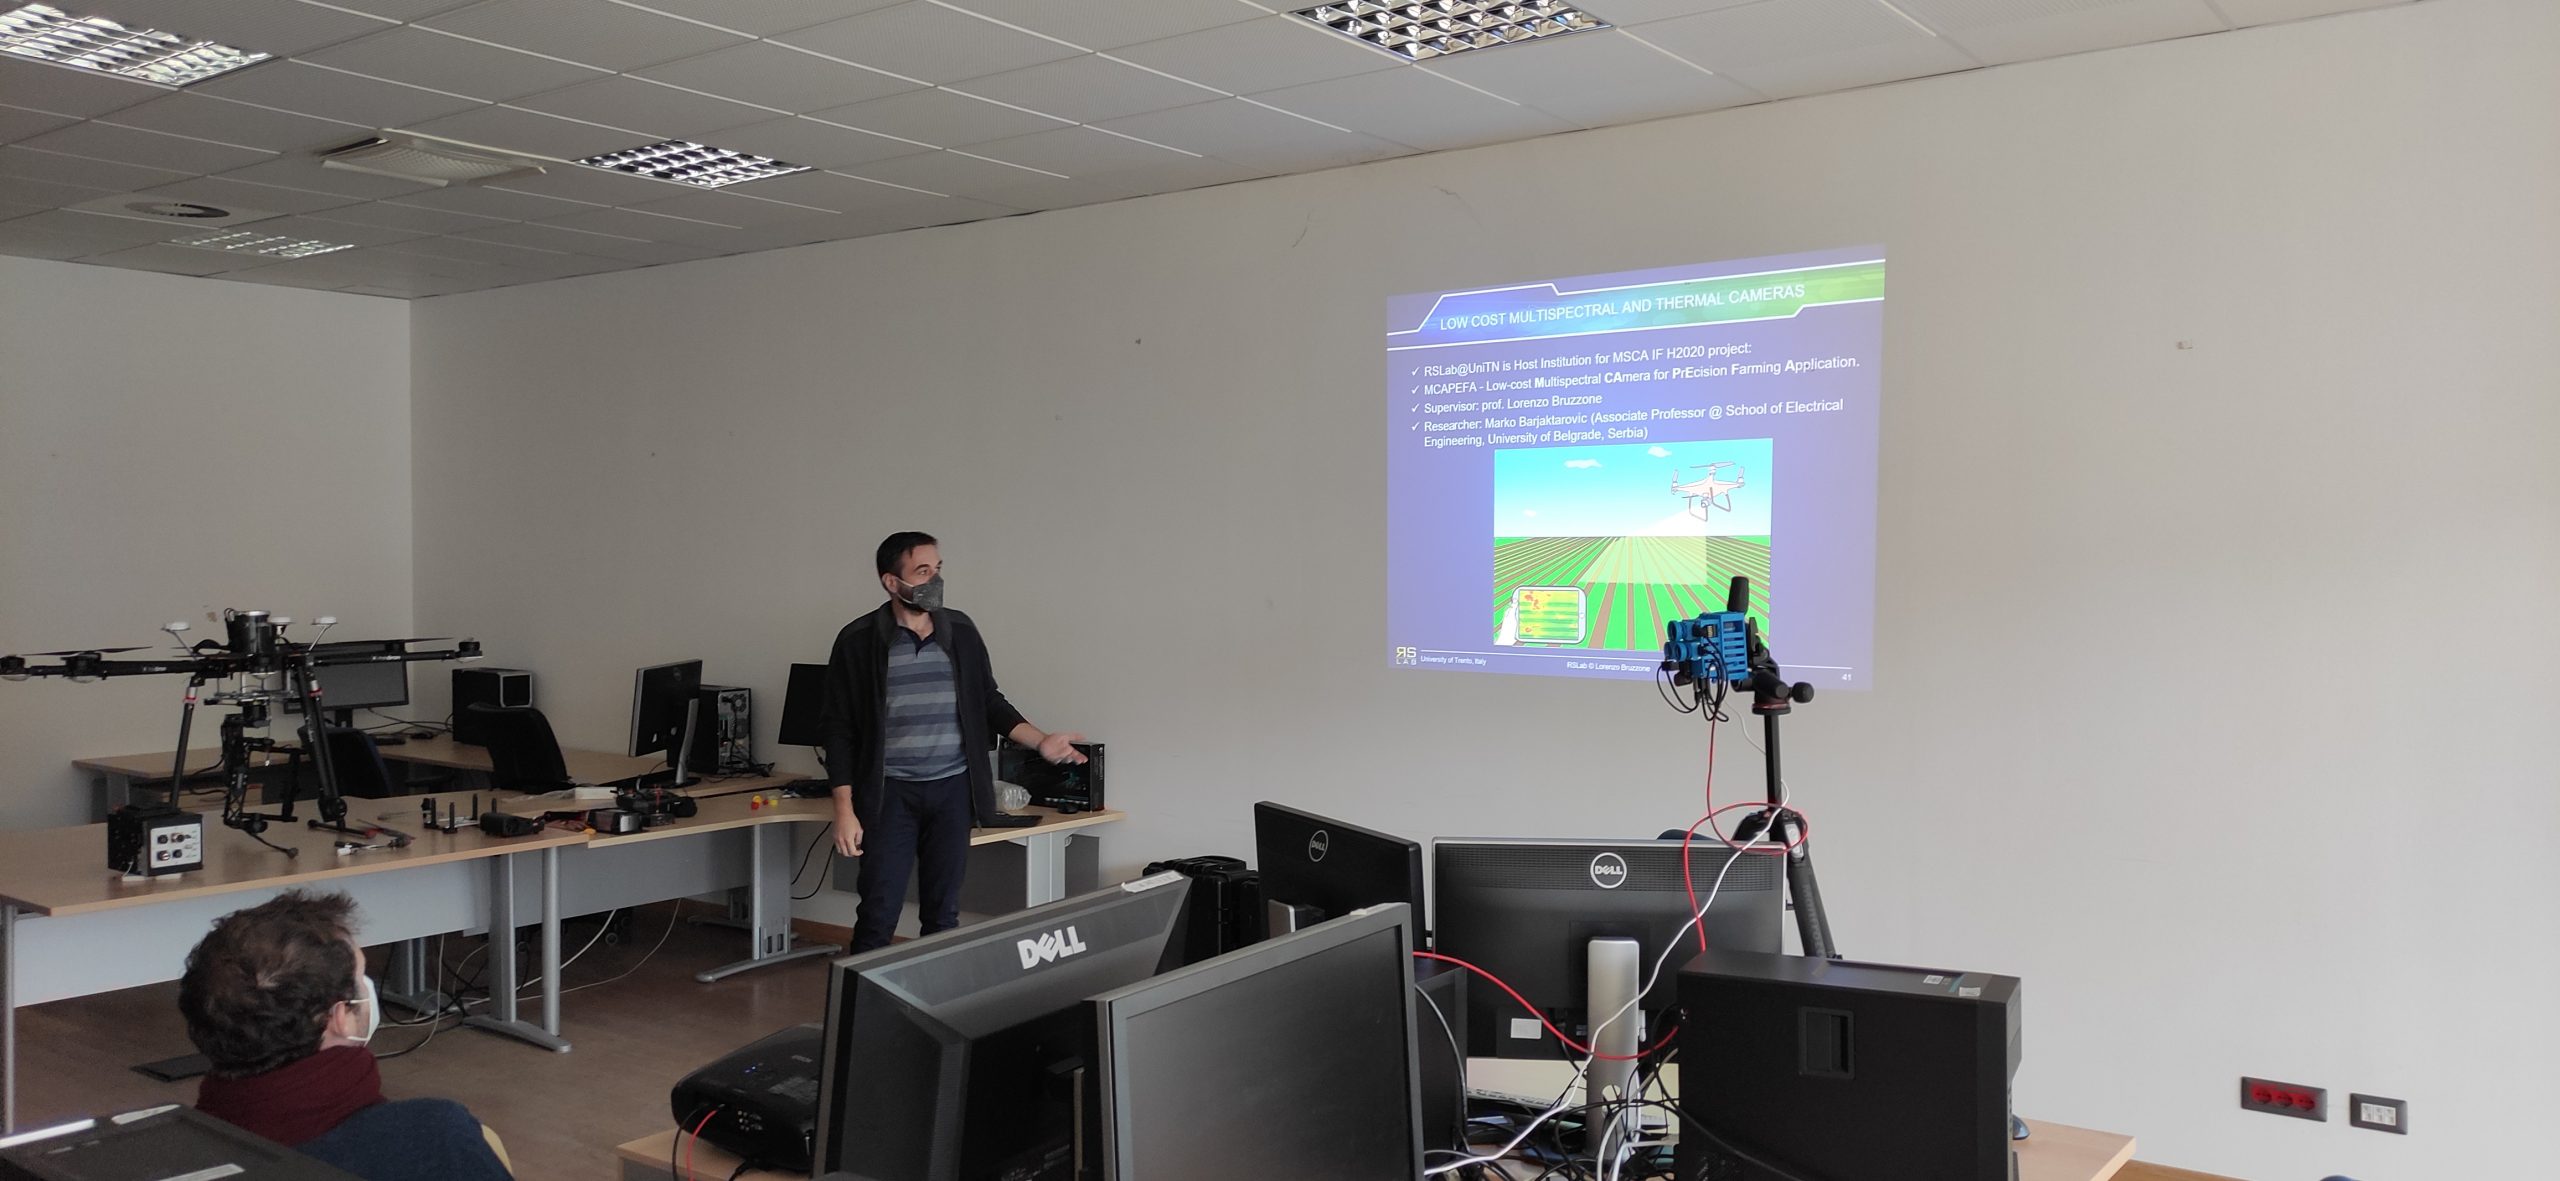
Presentation to the students of the University of Trento whose take courses in Remote sensing was given about the MCAPEFA project’s goals and how multispectral imaging can be used to solve some agriculture challenges.
MCAPEFA design and development
The most used multispectral cameras
Company
Model
Spectral Bands
Mapir Inc
Survey3
1 or 3 NB1
Unispectral
Monarch II
10 NB, in range [680, 940] nm
SenseFly
Parrot Sequoia
4 NB + RGB
Sentera
Double 4K Sensor
5 NB max
DJI
Mavic 3 MS
4 NB + RGB
AgEagle
RedEdge-P
5 NB + RGB
AgEagle
Altum-PT
5NB + TH + PAN
Agrowing
MS Quad Camera
10 NB
Silios
Toucan
10 NB
SAL. Eng.
MAIA S9
9 NB
Sentera
6X Thermal
4NB + TH + RGB
1 MS – Multispectral, TH – Thermal sensor, NB – narrow bands, PAN – Panchromatic sensor
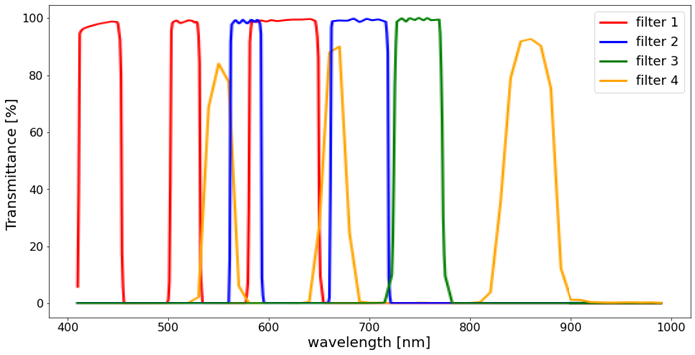
The prices depend on the number of different spectral bands, and for cameras with more than 5 narrow spectral bands or when the infrared thermal band is included cost is between 15 and 20 thousand euros. The only exception is Monarch II, but it uses one sensor and Fabri-Perot filter providing ten narrow bands, but for acquiring one multispectral image, objects must be still (about 150 ms) or very slow-moving. Another shortcoming is that all bands are in the range of 200 nm due to the Fabry-Perot filter’s periodicity. The idea behind the MCAPEFA camera is not a new one. It combines a color camera with a multiband filter, providing up to three bands at one color image sensor. For the control unit, Raspberry Pi 4 is selected. Sensors are from a dedicated quad camera kit. Each of the four cameras is the same with the IMX219 sensor. A thermal camera, Seek Mosaic Core, with 320×240 pixels and 70 mK thermal resolution, is included as there is a measurable difference between healthy and infected leaves (up to 1.3 °C) due to different ways how various leaf pathogens affect stomata opening and change transpiration between leaves and surrounding.Four filters: one single-band (750 nm), one dual-band (577/690 nm), and two triple-band (432/517/615 nm and 550/660/850 nm) were chosen, proving nine narrow bands in total.
Spectral transmittance of four selected filters
Final prototype (dimensions 120x80x60 mm).
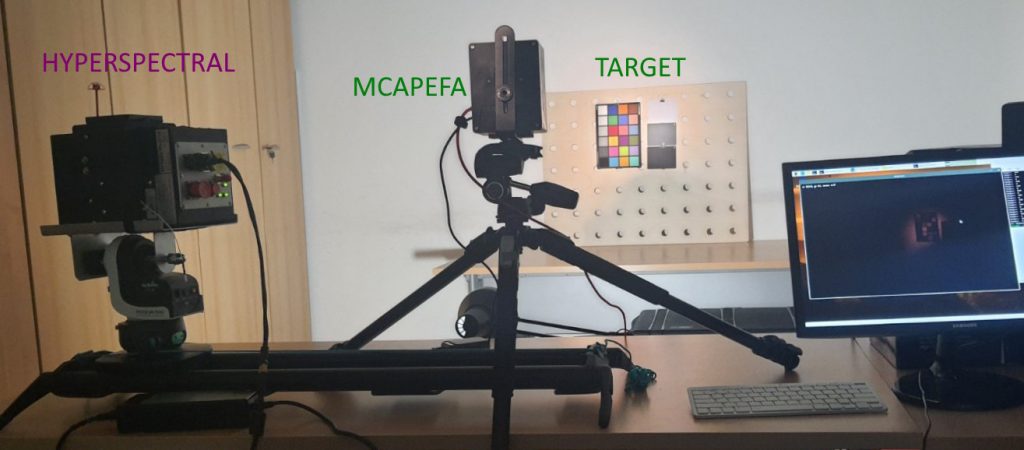
Spectral radiance for each band is calculated as a weighted sum of values from the appropriate RGB pixel. Coefficients for each single camera and appropriate filter combination was obtained with calibration. As a reference measuring device hyperspectral scanner was used with LED + QTH (Quartz Tungsten Halogen) lamps as a broadband source. Target was a standard photographic X-Rite ColorChecker Classic with 24 uniform patches of different colors, with means that the target includes 24 different spectral bands in each band of interest. For thermal calibration FLIR Duo Pro R as a reference device was used.
Calibration setup
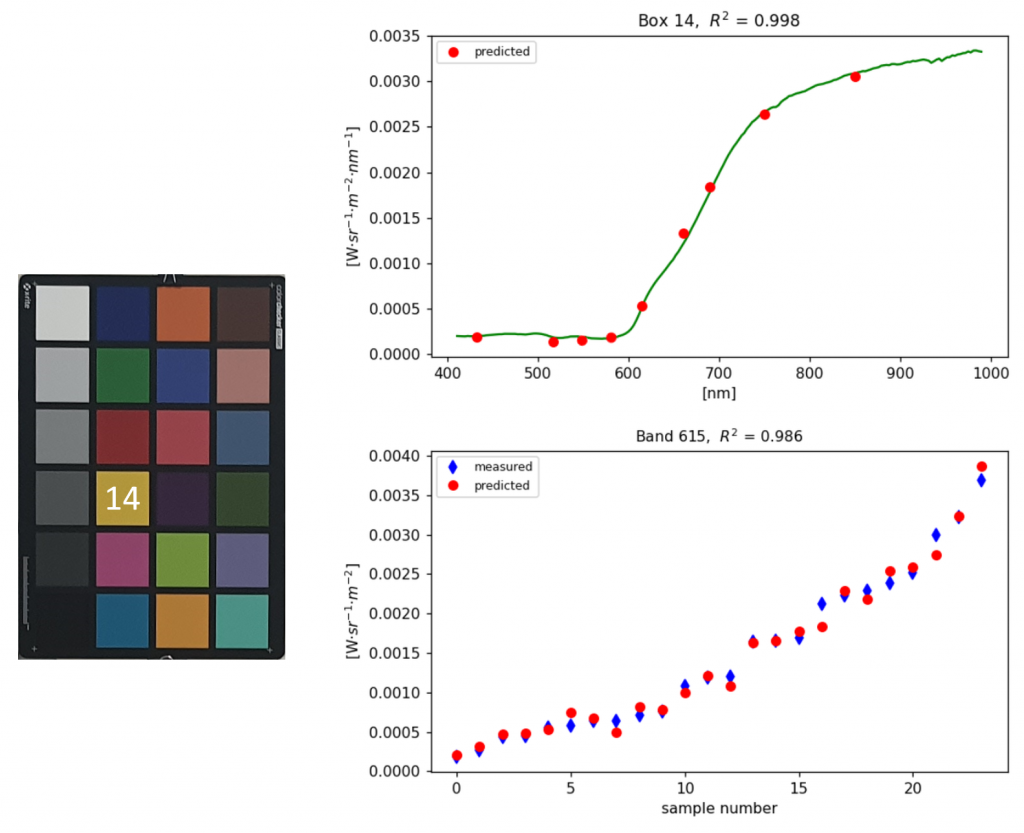
Quality of the spectral reconstruction
Flavescence dorée (it. Flavescenza dorata)
Usually, PA tries to solve region-dependent problems. For example, the most abundant cultivated plants in the Trentino region are apples and grapevines. In recent years, grapevine producers, not only in Trentino, but all around Southeast Europe, especially in Italy and France, very frequently had problems with Flavesence dorée (FD). For PA applications in which the MCAPEFA camera can contribute, FD detection is selected. FD is a grapevine disease caused by FD-phytoplasma. FD is transmitted from one plant to another with grafting or by the vector leafhopper Scaphoideus titanus Ball. It is an incurable, severe epidemic disease that can reduce production between 51 % and 92 % compared to healthy plants [1]. The economic impact of FD on Europe reflects in 3.2 million hectares which are 45 % of the world’s total wine-growing areas, where Spain, France, and Italy constitute three-quarters of it [2]. As FD has a devastating consequence on vineyards, it is quarantine disease, and the mandatory control procedures include the use of healthy plant material, spraying insecticides against the leafhopper, and uprooting each infected plant to eliminate sources of FD phytoplasma and to prevent spreading. Furthermore, when the infection exceeds 20 % of all plants, the obligation is to remove the whole vineyard. Uprooting the entire vineyard has a significant financial impact in the current and the following year since new plants need a few years to provide a substantial yield. This reflects the fact that only in 2005 Italian grapevine growers were supported with 34 million euros as compensation for FD’s loss [1]. In addition, Flavesence dorée constantly increases its presence spreading. Just considering the Piedmont region (Italy), from 2003 to 2018, FD spread from a few vineyards to almost 25 % of the entire grapevine area in Piedmont [3]. Furthermore, in Trentino Alto-Adige (Italy), the covered area with FD nearly doubled in just one year (from 2021 to 2022) [4]. Therefore, detecting even a single infected plant over an entire vineyard is essential to slow down or stop FD’s spreading and reduce economic loss.
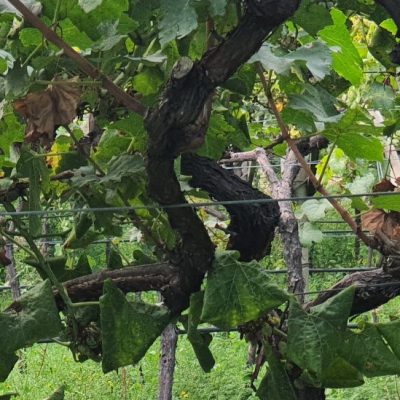
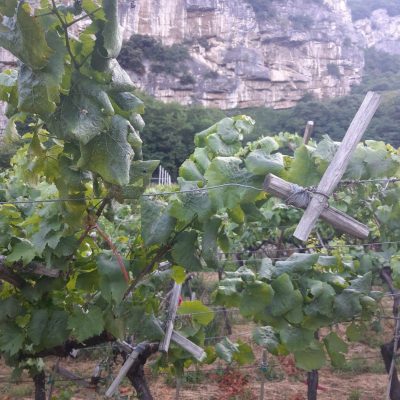
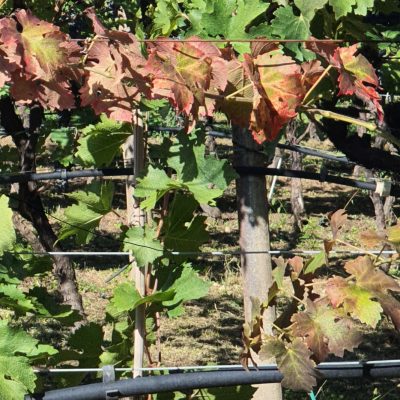
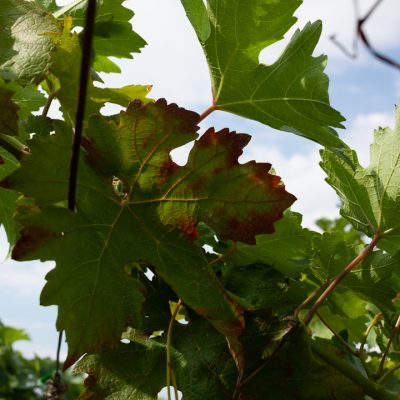
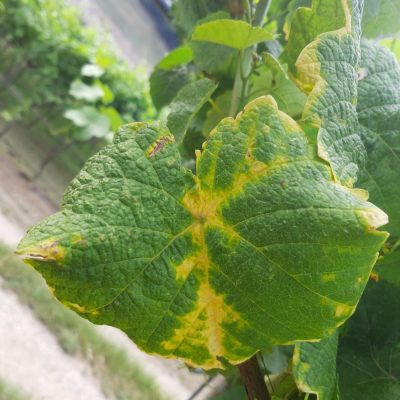
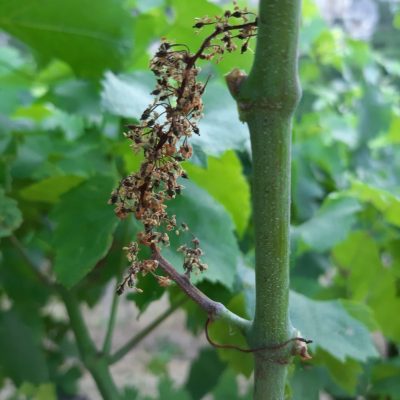
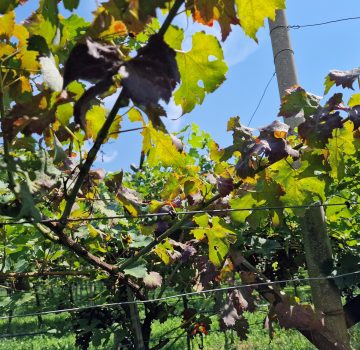
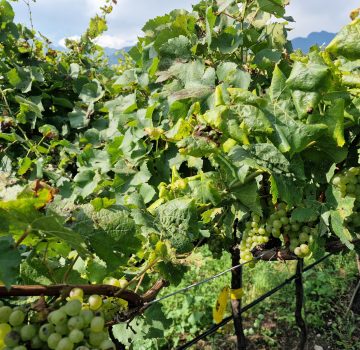
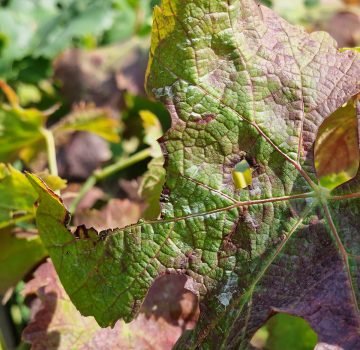
Currently, the only accessible method to detect FD is to scout vineyards, looking for FD’s dominant signs, which start to manifest in summer and can be spotted until mid-autumn. The symptoms are expressed one year after infection, but sometimes not after the first year and not on all the branches [5]. Also, the symptoms become more evident as the vegetative season makes progress. The most evident symptoms are on the leaves. They curl downwards and become yellowish or reddish in white and red cultivars, respectively. Next, on shoots, lignification is missing, and berries are wilting and drying out.
Some symptoms of Flavescence dorée
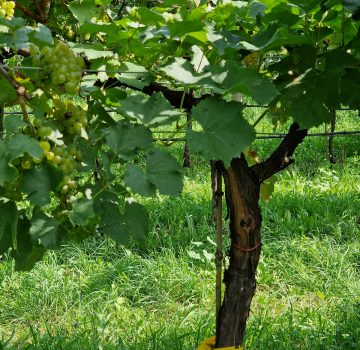
Chardonnay
Chardonnay (Source: Agraria Riva del Garda)
Cabernet Sauvignon
Cabernet Sauvignon
Cabernet Sauvignon
Traminer (Source: Agraria Riva del Garda)
Berries ((Source: Agraria Riva del Garda)
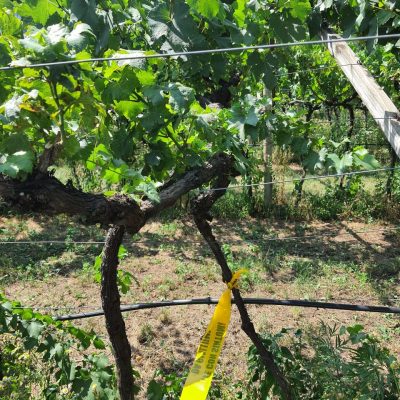
Flavescence dorée detection using hyperspectral imaging
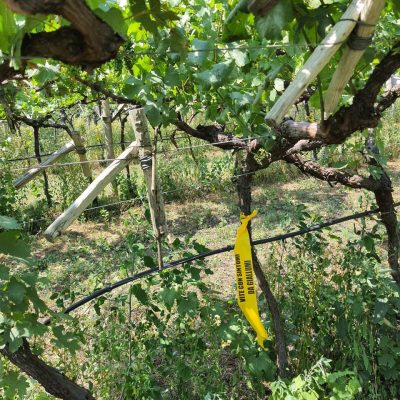
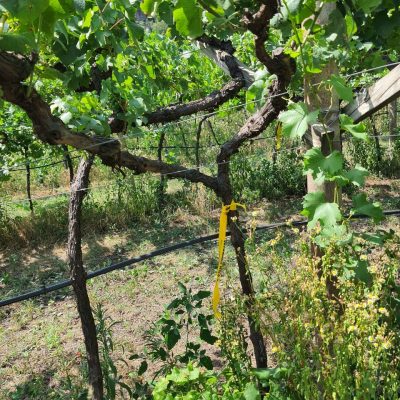
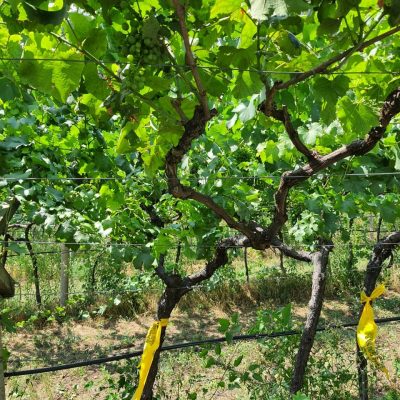
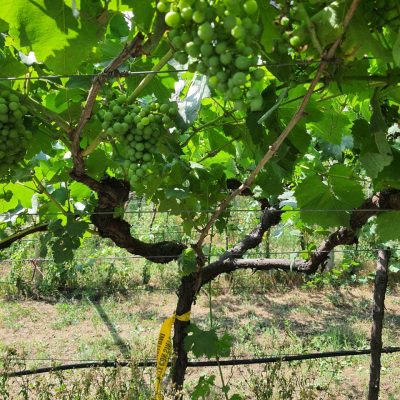
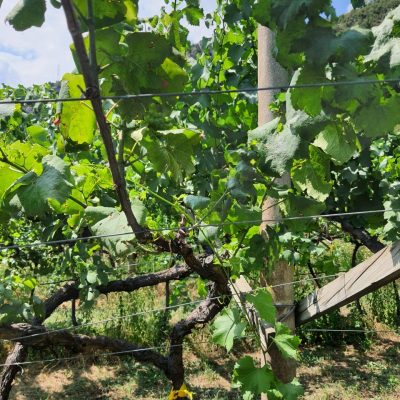
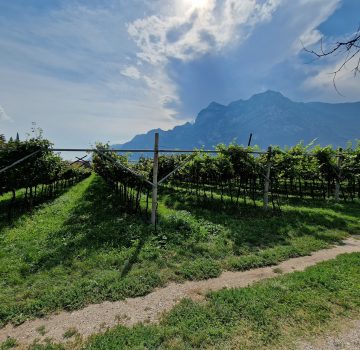
As there is evidence of FD’s influence on photosynthetic capacity alongside other morphological changes, such as leaf rolling, it is expected that hyperspectral imaging can be used for FD detection. The hyperspectral data can contain subtle spectral differences due to the progression of stress before any visible symptoms appear. This idea was successfully tested in several kinds of research. MCAPEFA project was started with the same idea but with a different way of acquiring hyperspectral data. Unlike other research where hyperspectral data from the leaves were taken in are highly controlled procedure, here hyperspectral camera was used in the same position where MCAPEFA was placed. In this way first, it can be tested is even possible to detect FD directly in the field using the hyperspectral camera when hyperspectral data is influenced by several factors like distance from leaf to the camera, shadowing, leaf orientation toward sunlight, and multi-scattering effect. This setup can show if it is justified to even use multispectral camera in the field for scouting the presence of FD. For places where acquisitions would have been conducted, two vineyards close to Riva del Garda were chosen. In these two vineyards, during 2021, several wines with FD were noticed, and due to the mandatory procedure, they were, of course, uprooted. One vineyard is with Cabernet Sauvignon (red grapevine variety) and is located in Bolognano, and the second vineyard contains Chardonnay (white variety), and it is near Nago-Torbole. In 2022 it was probable that FD would be found, as both grapevine varieties are highly susceptible to FD [1].
[1] E. Sandrine et al, “Contrasting Susceptibilities to Flavescence Dorée in Vitis vinifera, Rootstocks and Wild Vitis Species,” Front. Plant Sci., vol. 7, November 2016.
Bolognano (left) and Nago (right)
Infected plant 1
Infected plant 2
Infected plant 3
Infected plant 4
Infected plant 5
Infected plant 6
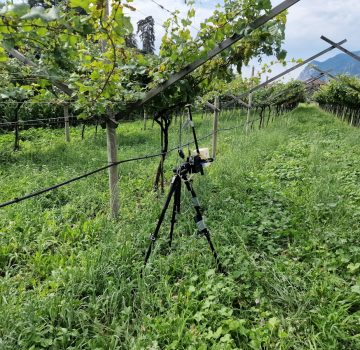
During data acquisition, FD presence in each plant was assessed in the field by a local expert who regularly visually observes vineyards to spot newly infected plants and prevent further spreading. The equipment used in the field campaign consists of a hyperspectral scanner HySpex Mjolnir V-1240, MCAPEFA camera, FLIR Duo Pro R thermal camera, and slider. The hyperspectral scanner has 200 channels in the 400 – 1000 nm range and 1240 samples in each channel. The slider was necessary as the HySpex camera is pushbroom based and must be moved during acquisition. The MCAPEFA was mounted on a standard photographic tripod, together with the high-quality thermal camera FLIR Duo Pro R. FLIR Duo Pro R has a resolution of 640×512 pixels, and it was used as a temperature reference sensor.
Equipment used in the field
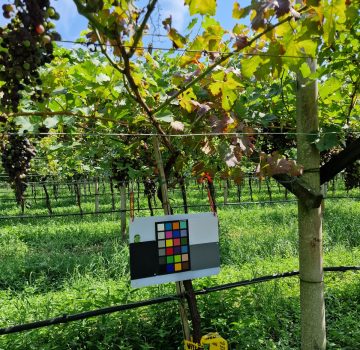
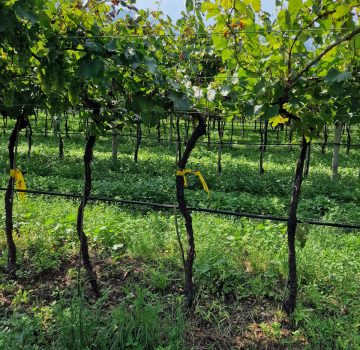
vineyard
Acquisition August 2023
camera
calibration target
Flavescence Dorée - image 1
Flavescence Dorée - image 2
Flavescence Dorée - image 3
Flavescence Dorée - image 4
Flavescence Dorée - image 5
The first campaign was conducted on 12th July 2022, between 10:00 and 13:00 in Bolognano and 14:30 and 17:30 in Nago-Torbole. During imaging, it was sunny. Hyperspectral data contains images of 5 healthy and 4 infected plants in Bolognano, while in Nago-Torbole 7 healthy and 6 were photographed.
In the second campaign, only MCAPEFA was used. The second data acquisition was organized on the 23rd of August 2022, between 10:30 and 13:00 in Nago-Torbole and 14:30 and 17:00 in Bolognano. As during the first acquisition, the weather was sunny without any clouds. Data taken during the second campaign contains 12 and 15 images of healthy and 14 and 13 infected plants.
The third data acquisition was on 22nd September 2022, between 10:00 and 12:00 in Bolognano and 14:00 and 16:30 in Nago-Torbole. This time, the weather was sunny with occasionally a few clouds resulting in an illumination variation that better represents different acquisition conditions. Obtained hyperspectral data contains images of 8 healthy and 6 infected plants in Bolognano, while in Nago-Torbole, 8 healthy and 7 infected plants.
Final acquisition was performed on 17th August 2023, between 10:00 and 16:00, at the vineyard near Riva del Garda. Data was collected for testing the algorithm for Flavescence Dorée detection using multispectral images. The algorithm will be developed using data obtained from previous campaigns, and this final image set is for the verification of the algorithm. This vineyard contains both white and red varieties, Chardonnay and Cabernet Sauvignon, respectively. As previous time, the weather was sunny with a few intervals of clouds, which better represents different acquisition conditions. There were several infected plants with Flavescence Dorée on both grapevine varieties.
MCAPEFA on the drone
The initial Idea was to use MCAPEFA for drone-based applications. However, due to some administrative constraints, it wasn’t possible to fly. In the beginning, it was considered a shortcoming, but soon it was not look like that anymore:
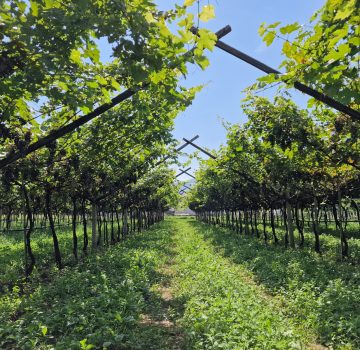
1. Due to the grapevines’ training system, many grow in guyot style (vertical), for which the image is taken in an oblique manner. That can influence measurement accuracy. 2. A drone and certified pilot are required. 3. There are many flighting restrictions when the target field is near roads, hospitals, police stations, houses, or other properties.
On the other hand, grapevine producers conduct some activities almost every two weeks in the vineyard, which is more than enough to scout for FD in the same field. Also, the natural light source is easier to block in close-range imaging, using controlled illumination with a hood. Placing a detection device on the tractor or similar vehicle, looking for FD or other issues, would be automatic and even more efficient than using a drone. However, as are many other possible applications in which MCAPEFA can be used, a test flight is desirable. For that purpose, one flight was taken on the 20th of October at Fondazione Edmund Mach (FEM), Trento, Italy, as there are several vineyards and available drone. For this, special thanks to Luca Delucchi from FEM, who organized the flight, piloted the drone and provided the drone. After the flight, using open source software for producing orthorectified images WebODM, orthomaps were generated from each camera, successfully showing that MCAPEFA can be used in drone-based applications.
Drone with MCAPEFA @ FEM
Orthorectified photo @ 750nm
Hyperspectral dataset generation and classification
After collecting data in the field, it was first necessary to test whether detecting FD using hyperspectral images is even feasible. Although several kinds of research showed that hyperspectral data could reveal FD, unlike those researches, here data was acquired directly in the field, not in a highly controlled environment.
The dataset was generated using obtained hyperspectral images. In each hyperspectral image, between 20 and 40 rectangular regions of interest (ROI) were selected. Each ROI is a patch from one green leaf, and the whole patch was exposed to sunlight or was in shadow. Each ROI is represented as its average spectral profile, which is then divided by the spectral radiance of the white target. Spectral radiances of the white target in shadow or on the sunlight were acquired several times while collecting data in each vineyard. In this manner, 996 spectral reflectance profiles for both infected and healthy plants were obtained.
Select ROI in one hyperspectral image
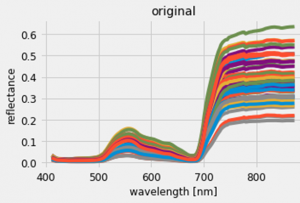
Before SNV
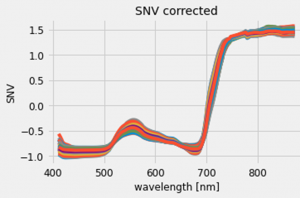
After SNV
When hyperspectral images are acquired in natural conditions, compensation of several optical phenomena is necessary. Besides directly reflected radiance, the total radiance from an observed leaf can include additive polynomial terms R2, RT, T2, R3, …, where R and T are the reflectance and transmittance of the surrounding leaves. Next, the radiance that reaches the detector is modified by the inclination of the leaf toward the illumination and by the distance between the leaf and the camera. The simplest but the most used method for compensating multi-scattering effects, leaf inclination, and distance to the camera is Standard Normalize Variate. With SNV, each profile is divided by standard variance after removing its mean value. The SNV was applied to each obtained profile.
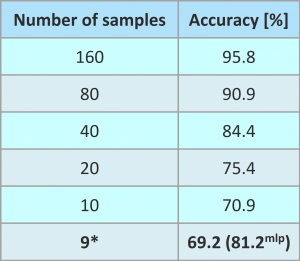
LDA (Linear Discriminant Analysis) was selected as an initial classifier, showing that this simple but robust method can provide high accuracy [%]: 95.8 ± 1.9, precision [%]: 0.961 ± 2.4, and recall [%]: 96.2 ± 2.8 %. Feature vector contained all wavelengths up to 880 nm, as higher wavelengths contain significant noise levels. Next, the feature vector size was reduced several times, halving the each time number of features from initial 160 up to 10 in a four steps, resulting in lower accuracy. Also, with the test with reflectance values only at MCAPEFA’s wavelengths, accuracy dropped to 69.2 %. An additional test was performed using a small MLP (multilayer perceptron) as a nonlinear classifier, increasing accuracy to 81.2 %. It is believed that adding more features, like some texture ones, can improve accuracy when only MCAPEFA data is used for detecting FD.
Select ROI in one hyperspectral image
Second hyperspectral dataset generation and classification
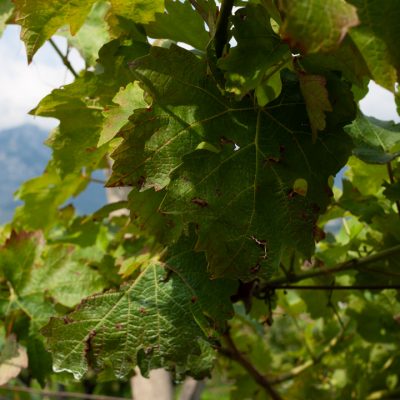
It can be noticed that spectral reflectance from leaves with highly expressed symptoms has noticeable differences compared to profiles from the green leaves.
Top: Spectral reflectance for healthy, infected green, and infected discolored leaves.
Right: Healthy and infected green leaves. Left column Cabernet Sauvignon, right: Chardonnay. From top: healthy, infected from July, infected from September.
The next idea was to restrict investigation only to infected and healthy green leaves. This test can show if it is even possible to detect FD when the discoloration of leaves is not highly expressed, which can result in earlier detection. Photos of green leaves for both Cabernet Sauvignon and Chardonnay, when there are no FD symptoms, show that it is complicated to spot differences between images of healthy and infected leaves. For sure, there are some differences in the leave’s texture, but to notice this, a lot of experience and training is needed.
For testing, if hyperspectral data can be used to detect FD only using green leaves, which can provide earlier detection and prevent some spreading, the same procedure was repeated to obtain the new set of spectral profiles.
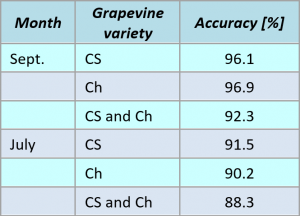
This second dataset with hyperspectral data contains 110 and 131 reflectance profiles of healthy leaves for Cabernet Sauvignon and Chardonnay, respectively, whose images were taken in July. Next, the dataset has 112 and 131 spectrums from FD-infected plants. From the acquisition conducted in September, 104 and 106 healthy and 120 and 121 infected profiles were provided for Cabernet Sauvignon and for Chardonnay, respectively.
This time, MLP was used as a classifier, and results showed that accuracy is lower when data from July is used (which is expected as symptoms progress with vegetative season), especially when profiles from both varieties are used together. Still, accuracy is high enough to test if this approach can be scaled to multispectral data.